
· 1 Minutes to read
Allen Ma

Case (I) python warm-up

Project 3: Crawling the university ranking of a province

Enter the name of a province and crawl the data from "SoftTech China's Best Universities Ranking 2020" (http://www.zuihaodaxue.cn/zuihaodaxuepaiming2020.html) developed by Shanghai Jiao Tong University to output the province's 2020 University rankings for that province in 2020. Input: Guangdong Output.在这里插入图片描述

import requests
from bs4 import BeautifulSoup
import bs4


def getHTMLText(url):
try:
r = requests.get(url, timeout=30)
r.raise_for_status()
r.encoding = r.apparent_encoding
return r.text
except:
return ""


def fillUnivList(ulist, html):
soup = BeautifulSoup(html, "html.parser")
for tr in soup.find('tbody').children:
if isinstance(tr, bs4.element.Tag):
tds = tr('td')
ulist.append([tds[0].string, tds[1].string, tds[2].string])


def printUnivList(ulist, num, place):
tplt = "{0:^10}\t{1:{3}^10}\t{2:^10}"
print("{:^10}\t{:^6}\t{:^10}".format("排名", "学校名称", "省市"))
for i in range(num):
u = ulist[i]
if u[2] == place:
print(tplt.format(u[0], u[1], u[2], chr(12288)))
# print("{:^10}\t{:^6}\t{:^10}".format(u[0], u[1], u[2]))
else:
continue

def main():
uinfo = []
url = 'http://www.zuihaodaxue.cn/zuihaodaxuepaiming2019.html'
html = getHTMLText(url)
fillUnivList(uinfo, html)
printUnivList(uinfo, 549, "广东") # 20 univs


main()

Results of the run. 在这里插入图片描述

· 6 Minutes to read
Allen Ma

I recently joined a factory for an internship in an internet finance related position and found a few rhymes with what I had learned. So I decided to take the time to list a few relevant cases to learn and learn.

Case (I) python warm-up

Most of the data acquisition and processing in the project uses the python programming language, so let's first review some common functions and writing rules.

Project one: dictionary statistics sorting

The dictionary d stores the correspondence between the 42 double-class universities in China and the provinces where they are located. Please use this list as a data variable to improve the Python code and count the number of schools in each province.‬‬‬‬‬‬‬‬‬‬‬‬‬‬‬‬‬‬‬‬‬‬‬‬‬‬‬‬‬‬‬‬‬‬‬‬‬‬‬‬‬‬‬‬‬‬‬‬‬‬‬‬‬‬‬‬‬‬‬‬‬‬‬‬‬‬‬‬‬‬‬‬‬‬‬‬‬‬‬‬‬‬‬‬‬‬‬‬‬‬‬‬‬‬‬‬‬‬‬‬‬‬‬‬‬‬‬‬‬‬‬‬‬‬‬‬‬‬‬‬‬‬‬‬‬‬‬‬‬‬‬‬‬‬‬‬‬‬‬‬‬‬‬‬‬‬‬‬‬‬‬‬‬‬‬‬‬‬‬‬‬‬‬‬‬‬‬‬‬‬‬‬‬‬‬‬‬‬‬‬‬‬‬‬‬‬‬‬‬‬‬‬‬‬‬‬‬‬‬‬‬‬‬‬‬‬‬‬‬‬‬‬‬‬‬‬‬‬‬‬‬‬‬‬

The output shows the provinces with the highest numbers and the quantities.‬‬‬‬‬‬‬‬‬‬‬‬‬‬‬‬‬‬‬‬‬‬‬‬‬‬‬‬‬‬‬‬‬‬‬‬‬‬‬‬‬‬‬‬‬‬‬‬‬‬‬‬‬‬‬‬‬‬‬‬‬‬‬‬‬‬‬‬‬‬‬‬‬‬‬‬‬‬‬‬‬‬‬‬‬‬‬‬‬‬‬‬‬‬‬‬

d = {"北京大学":"北京", "中国人民大学":"北京","清华大学":"北京",\ "北京航空航天大学":"北京","北京理工大学":"北京","中国农业大学":"北京",\ "北京师范大学":"北京","中央民族大学":"北京","南开大学":"天津",\ "天津大学":"天津","大连理工大学":"辽宁","吉林大学":"吉林",\ "哈尔滨工业大学":"黑龙江","复旦大学":"上海", "同济大学":"上海",\ "上海交通大学":"上海","华东师范大学":"上海", "南京大学":"江苏",\ "东南大学":"江苏","浙江大学":"浙江","中国科学技术大学":"安徽",\ "厦门大学":"福建","山东大学":"山东", "中国海洋大学":"山东",\ "武汉大学":"湖北","华中科技大学":"湖北", "中南大学":"湖南",\ "中山大学":"广东","华南理工大学":"广东", "四川大学":"四川",\ "电子科技大学":"四川","重庆大学":"重庆","西安交通大学":"陕西",\ "西北工业大学":"陕西","兰州大学":"甘肃", "国防科技大学":"湖南",\ "东北大学":"辽宁","郑州大学":"河南", "湖南大学":"湖南", "云南大学":"云南", \ "西北农林科技大学":"陕西", "新疆大学":"新疆"}

输出格式 == Province: Number (Chinese colon)==

d = {"北京大学":"北京", "中国人民大学":"北京", "清华大学":"北京",
"北京航空航天大学":"北京", "北京理工大学":"北京", "中国农业大学":"北京",
"北京师范大学":"北京", "中央民族大学":"北京", "南开大学":"天津",
"天津大学":"天津", "大连理工大学":"辽宁", "吉林大学":"吉林",
"哈尔滨工业大学":"黑龙江", "复旦大学":"上海", "同济大学":"上海",
"上海交通大学":"上海","华东师范大学":"上海", "南京大学":"江苏",
"东南大学":"江苏", "浙江大学":"浙江", "中国科学技术大学":"安徽",
"厦门大学":"福建", "山东大学":"山东", "中国海洋大学":"山东",
"武汉大学":"湖北", "华中科技大学":"湖北", "中南大学":"湖南",
"中山大学":"广东", "华南理工大学":"广东", "四川大学":"四川",
"电子科技大学":"四川", "重庆大学":"重庆", "西安交通大学":"陕西",
"西北工业大学":"陕西", "兰州大学":"甘肃", "国防科技大学":"湖南",
"东北大学":"辽宁","郑州大学":"河南", "湖南大学":"湖南", "云南大学":"云南",
"西北农林科技大学":"陕西", "新疆大学":"新疆"}
counts = {}
for place in d.values():
counts[place] = counts.get(place, 0) + 1
items = list(counts.items())
items.sort(key=lambda x: x[1], reverse=True)
print(items[0][0]+':'+str(items[0][1]))

Results of the run. pg1

Project 2: Calculating the annual growth rate of mobile phone sales

  1. The file smartphone.txt holds annual sales data of mobile phones for certain companies, with each row containing a number of annual sales (in millions) for each company, with tabs as separators between the data.

  2. To open the file, please specify the file encoding format: with open("smartPhone.txt",encoding="gbk") as f:

smartPhone.txt文件内容如下:

公司  2014年   2015年   2016年   2017年
Samsung 311 322.9 310.3 318.7
Apple 192.9 231.6 215.2 15.8
Huawei 73.6 104.8 139.1 153.1
OPPO 29.9 50.1 92.9 121.1
Vivo 19.5 40.5 74.3 100.7
ZTE 43.8 56.2 60.1 44.9
LG 59.2 59.7 55.1 55.9
Lenovo 70.1 74.1 50.7 49.7
Xiaomi 61.1 70.7 61.5 96.1
  1. write function isBigGrowth(L, rate), the form of reference L for a set of numerical data containing a list (a company's sales in various years), rate for the annual growth rate, to determine and return whether the annual sales growth: if the annual sales growth rate exceeds the given rate, it is True, otherwise False.

  2. The main program reads the data in smartphone.txt, converts each line of data into numerical data, and uses the function isBigGrowth(L,rate) to calculate and screen output whether the annual sales of each company are growing rapidly (this question sets the annual sales growth rate of more than 30% for rapid growth), with tabs separating the data.

  3. The results of the program are shown below.

Mobile phone companyIs there rapid growth?
SamsungNo
AppleNo
HuaweiNo
OPPOFast
VivoFast
ZTENo
LGNo
LenovoNo
Xiaomino
import os

def isBigGrowth(L,rate):
if float (L[2])>float(L[1])*(1+rate) and float(L[3])>float(L[2])*(1+rate) and float(L[4])>float(L[3])*(1+rate):
return "快速"
else:
return "否"

with open(r"文件路径\smartPhone.txt") as f:
line = f.read().strip()
linestr = line.split("\n") # 以换行符分隔
del linestr[0]
print("手机公司 是否快速增长?")
for s in linestr:
try:
L = s.split('\t')
print(L[0], end=" ")
print(isBigGrowth(L, 0.3))
except:
print('运行失败')

Results of the run. 在这里插入图片描述

· 6 Minutes to read
Allen Ma

# Quality fundamentals for stock pool creation

Fundamental data of listed companies is an important evidence reflecting the historical performance of the company's operation and an important basis for investors to judge the future development prospect of the company. Financial analysts and stock investors need to analyse the quality of the company's fundamentals to assess the investment value of the company's stocks. The fundamental data of listed companies obtained from the Tushare platform mainly includes regularly published reports on the company's operating results, profitability, operating capacity, growth capacity, solvency and cash flow, which reflect the company's operating conditions at different levels respectively.

With nearly 3,600 normally traded stocks in China's stock market (Shanghai Stock Exchange and Shenzhen Stock Exchange), it is impossible for the average investor to have enough time and energy to analyse the fundamental data of all listed companies when choosing the ideal investment target. Therefore, it is necessary for investors to automate the screening of stocks in the market using some key indicators with empirical guidance, i.e. relying on a computer programme to screen out stocks with high quality fundamentals from the full range of listed company stocks, thereby significantly improving the efficiency of investors in finding stocks of high quality companies. For example, a company's profitability, growth and cash flow are some of the indicators used to identify quality stocks as candidates for investment.

The basic steps for screening quality stocks are the following 4 steps.

① Use the fundamental data interface function built into the Tushare package to obtain the fundamental data of all stocks.

② Determine the key indicator items reflecting the quality of fundamentals based on experience and extract the data series corresponding to the key indicator items from the fundamentals data of all stocks.

③ Use Pandas built-in function to merge multiple fundamental data series into one DataFrame data.

④ Determine the sorting parameters of the data series according to the importance of the key indicator items and sort the merged data. From the ranking results, the top rows of each indicator are selected, and the stocks corresponding to these rows are the set of stocks with relatively high fundamental quality (i.e. the quality stock pool).

The table below shows the interface functions for obtaining company profitability, growth and cash flow fundamentals and the information on the parameters returned. 在这里插入图片描述 From the data items returned by the functions listed in the table above, the interface function returns a very rich variety of data that can be used to reflect the value of the company's investment in a number of combinations of data items. For example, the return parameters from the three types of data listed in the table above select the net interest rate, return on net assets, earnings per share growth rate, net profit growth rate, earnings per share growth rate, the ratio of net operating cash flow to net profit and cash flow ratio as key evaluation indicators, and the comprehensive use of the value of these seven indicators to reflect the quality of the company's fundamentals. Generally, the higher the value of these indicators, the higher the fundamental quality of the company and the greater the investment value of the company's shares. The following program demonstrates a method of using financial indicator data to screen for quality company stocks.

import tushare as ts
import pandas as pd
import datetime

# Get the latest financial statement data. The financial report disclosure time for A-share listed companies in China stipulates that the first quarterly report should be disclosed by April 30, the
# disclose the half-yearly report by August 31, the third quarterly report by October 30, and the annual report by April 30 of the following year.
this_year = datetime.datetime.today().year
this_month = datetime.datetime.today().month
if this_month >= 11: # This year's third quarterly report has been published
fin_year = this_year
fin_sea = 3
elif this_month >= 5: # The previous year's annual report is usually published at the end of April, although the first quarter of the year is also optional
fin_year = this_year-1
fin_sea = 4
else:
fin_year = this_year-1
fin_sea = 3
print("%s year %s quarter" %(fin_year,fin_sea))

printout: 4 quarters of 2019

df1 = ts.get_profit_data(fin_year, fin_sea)
df2 = ts.get_growth_data(fin_year, fin_sea)
df3 = ts.get_cashflow_data(fin_year, fin_sea)

在这里插入图片描述如果在If you have saved the financial data file before running the program, you can read the financial data directly from the local data file, thus avoiding the need to download the same data every time you run the program.

#code, code; name, name; net_profit_ratio, net profit margin (%); roe, return on net assets (%); eps, earnings per share.
#nprg, net profit growth rate (%); nav, net asset growth rate.
df_merge = pd.merge(df1[['code','name', 'net_profit_ratio', 'roe', 'eps']],
df2[['code', 'nprg', 'nav']], on='code', how='left')
#left outer join, left table unrestricted, keep data from left table, match right table, columns in rows not matched by right table are shown as NaN
#cf_nm, ratio of net operating cash flow to net profit; cashflowratio, cash flow ratio.
df_merge = pd.merge(df_merge, df3[['code', 'cf_nm', 'cashflowratio']],
on='code', how='left').dropna() # Delete rows containing NaN
focus_df = df_merge.sort_values(['nprg', 'net_profit_ratio', 'cf_nm', 'nav',
'roe', 'eps', 'cashflowratio'], ascending=False)#nprg is the first keyword

Regarding the order of the key columns for sorting the consolidated statement, the interested reader can make more order adjustments, compare the set of stocks and their sorting in the final retained data table select_df, examine how the results of the sorting operation differ for different indicator orders, and find the corresponding stocks to understand the price changes of the stocks over the last 3 years.

focus_df['code']='\t'+ focus_df['code']# ensure that the code is entered into the csv file in the form of characters, \t is a tab
if focus_df.iloc[:, 0].size > 100:
select_df = focus_df[['code', 'name', 'nprg', 'net_profit_ratio', 'cf_nm', 'nav',
'roe', 'eps', 'cashflowratio']].head(100)
else:
select_df = focus_df[['code', 'name', 'nprg', 'net_profit_ratio', 'cf_nm', 'nav',
'roe', 'eps', 'cashflowratio']]
select_df.to_csv('focus'+str(fin_year)+str(fin_sea)+'.csv',encoding='cp936',index=False)

在这里插入图片描述 The disclosure time for financial reports of A-share listed companies in China is stipulated as follows: the first quarterly report is disclosed by 30 April, the half-yearly report by 31 August, the third quarterly report by 30 October, and the annual report is disclosed by 30 April of the following year. The program uses the date function of the datatime package to determine the available financial report data.

From the reality of the stock market, there is no uniform standard for selecting key indicators of listed company stocks with quality fundamentals, partly because there are differences when different financial indicators reflect a company's focus, and partly because the numerical comparability of financial data indicators of companies in different industries is inconclusive. This example only provides a method to improve the efficiency of stock screening of quality companies using a Python program, and does not provide an investment basis for screening quality stocks.

· 5 Minutes to read
Allen Ma

Tushare financial data interface

Plotting stock k-line charts

The structure and changing characteristics of different types of financial data vary, and naturally the form of charts suitable for describing the characteristics of different types of data will also vary. Line and point charts are the most common two-dimensional charts used by financial analysts, as they are easier to show the changing characteristics of financial data and are simpler to draw. This section introduces the basic methods of visualising time series data in the Python language using the drawing of stock k-line charts (also known as candlestick charts) as an example.

The process of plotting stock k-line charts using Tushare platform data in the Python runtime environment consists of three main steps as follows.

Step 1: Determine the data source. In this section, we choose to obtain stock ticker data from the Tushare platform and use the built-in interface functions of the Tushare package to obtain stock ticker data, so we first import the Tushare package using the command import tushare.

Step 2: Determine the form of the visualisation and the tools to implement it. In this section, the financials charting package mpl_finance is chosen as the tool for drawing k-line charts of stock prices, so you need to use the command "from mpl_finance import candlestick_ochl" to import the sub-module for drawing k-line charts from the mpl_finance package module candlestick_ochl. The mpl_finance package is a separate graphics package from Matplotlib (the command "pip install mpl_finance" completes the installation of the package) and is usually used for plotting stock price k-line charts and line charts. As the pro interface functions provided by the Tushare package differ from the data structure returned by the normal interface functions, it is necessary to ensure that the data format matches when calling the plotting functions. The program in this section makes use of the pro interface's pro.daily() function to obtain daily stock data and adapt the tick data structure appropriately to the requirements of the parameter format of the candlestick_ochl() function of the mpl_finance package. In addition, the number of k-lines drawn in the output chart should not be too high, as too many k-lines will inevitably lead to too small a distance between the k-lines and make the k-chart less clear.

Step 3: Determine the output tool for drawing the chart. This section selects the charting package Matplotlib as the output tool for the k-line chart, because Matplotlib package provides a wealth of chart output functions, which can be set relatively easily for the structure of the chart layout, colour and axis format and many other aspects, making the chart more beautiful and easier to understand. Therefore the module Matplotlib needs to be imported into the program with the command "import matplotlib".

import tushare as ts
import pandas as pd
import numpy as np
import matplotlib.pyplot as plt
from matplotlib import ticker
from matplotlib.pylab import date2num
#from mpl_finance import candlestick_ochl #need to install the mpl_finance package separately
from mplfinance.original_flavor import candlestick_ochl #need to install the mpl_finance package separately
plt.rcParams['font.sans-serif'] = ['SimHei'] # Used to display Chinese labels normally

# Users with sufficient permissions are using the pro interface to get data
pro = ts.pro_api()
code = '600004.SH'
df = pro.daily(ts_code=code, start_date='20191201')
df.shape
#stock_daily = pro.daily(ts_code=code, start_date='20181201')
# stock_daily.to_excel('stock_daily.xlsx') # save as spreadsheet

# Users who do not have sufficient permissions to use the pro interface to get the data execute the following code to get the data directly from the xlxs file
df = pd.read_excel('stock_daily.xlsx', dtype={'code': 'str','trade_date': 'str'})
df.drop(df.columns[0], axis=1, inplace=True)
df.shape

df2 = df.query('trade_date >= "20171001"').reset_index() # select data after Oct 1, 2017
df2 = df2.sort_values(by='trade_date', ascending=True) # sort the original data in descending order by date
df2['dates'] = np.range(0, len(df2)) # len(df2) refers to the number of records
fig, ax = plt.subplots(figsize=(20, 9))
fig.subplots_adjust(bottom=0.2) # control subplots
### arguments to the candlestick_ochl() function
# ax Examples of plotting Axes
# quotes sequence (time, open, close, high, low) time is of type float, date must be converted to float
# width The width of the red and green rectangle in the image, representing the number of days
# colourup the colour of the closing price if it is greater than the opening price
# colordown the colour of the rectangle if it is lower than the opening price
# alpha the transparency of the colour of the rectangle
candlestick_ochl(ax, quotes=df2[['dates', 'open', 'close', 'high', 'low']].values,
width=0.55, colorup='r', colordown='g', alpha=0.95)
date_tickers = df2['trade_date'].values
def format_date(x, pos):
if (x < 0) or (x > len(date_tickers)-1):
return ''
return date_tickers[int(x)]
ax.xaxis.set_major_formatter(ticker.FuncFormatter(format_date)) # select and display the time scale on the horizontal axis according to certain rules
plt.xticks(rotation=30) # set the angle of rotation of the date scale
ax.set_ylabel('transaction_price')
plt.title(code)
plt.grid(True) # add grid, optional, just makes the image look better
plt.xlabel('trade date')
plt.show()


在这里插入图片描述

· 5 Minutes to read
Allen Ma

Tushare Financial Data Interface

# Stock Fundamental Statistics

Use the get_stock_basics() function to download all stock fundamental data at once. This is useful for looking at the overall market situation of a stock.

import  tushare  as  ts
import pandas as pd
import numpy as np
import matplotlib.pyplot as plt

stock = ts.get_stock_basics() # Download Stock Fundamental Data
stock.to_excel('stock.xlsx') # Save as spreadsheet
stock.shape # Out: (3678, 22)

在这里插入图片描述在这里插入图片描述 The size of the dataset is 3823x22 and each row is the basic data for one stock. See Tushare's website for field details. See the http://tushare.org website for details of the data set fields. The data columns used in this section are: code, stock code; name, name; industry, industry; area, region; pe, price-to-earnings ratio; totals, total equity (RMB 100 million); esp, earnings per share; timeToMarket, date of listing.

The data is read from the spreadsheet file below, noting the details of the handling of the stock code column. pandas always tries to automatically convert the data to a numeric type when reading it. If a stock code like '002522' is read in for the Shenzhen market, the leading character '00' will be lost and it will become the integer 2522, so the code field is deliberately specified as a string when reading.

df = pd.read_excel('stock.xlsx', dtype={'code': 'str'})   # code string type
df.set_index('code', inplace=True) # Set code as index column
df.loc['002522'] # Showing the fundamentals of a stock

在这里插入图片描述

len(df.industry.unique())   # Show industry numbers

在这里插入图片描述

len(df.area.unique())  # Showing the number of regions (i.e. the provinces to which the shares belong)

在这里插入图片描述

# Number of listed companies by region, reflecting regional economic strength
df.groupby('area').size().sort_values(ascending=False)

在这里插入图片描述 As can be seen from the above statistics, the more economically developed and dynamic the region, the greater the number of listed companies. The reader can also perform similar statistics by industry. The timeToMarket field in the data box represents the date of listing and is an integer in the format of "20190315". We can extract the year from it to count the number of shares issued each year.

year = df.timeToMarket.astype('str').str[:4]  # Convert to a string and extract the first 4 digits of the year
yearnum = df.groupby(year).size() # Statistics by year to obtain the number of shares issued per year
yearnum

在这里插入图片描述

plt.rcParams['font.sans-serif'] = ['SimHei'] # Specify Chinese bold font
# False below fixes a problem with the negative '-' sign on the axis being displayed as a square
plt.rcParams['axes.unicode_minus'] = False
# There are a few stocks in the dataset that do not have a year of issue (year 0), exclude year 0 from the graph
yearnum[yearnum.index!='0'].plot(fontsize=14, title='年IPO数量')

在这里插入图片描述从图中It can be seen that several highs in the year of IPO issuance correspond to several bull market times in the domestic stock market, with the number of issuances falling to a low during bear markets. The following calculates the market's average price-to-earnings ratio, pe, which is an important parameter in measuring stock market valuation.

df.pe.mean()            # Simple arithmetic average pe

在这里插入图片描述 Looking at the dataset reveals that the pe of loss-making stocks in the dataset is 0. Therefore, the removal of loss-making stocks is considered.

df[df.pe > 0].pe.mean()     # Calculating pe averages after excluding loss-making stocks

在这里插入图片描述 The pe above is a simple arithmetic average, a weighted pe with market capitalisation as the weighting may be a more accurate reflection of market conditions. As the total market capitalisation and stock unit prices are not available in the downloaded dataset, the total market capitalisation can only be extrapolated from the available fields. It is also common in data processing to calculate new column values from the values of certain columns. Here the total market capitalisation is extrapolated on the basis of Unit price of stock = 4esp (earnings per share) pe (price-to-earnings ratio) Total market capitalisation = share unit price *totals total equity (RMB billion) The earnings per share esp in the dataset is for a single quarter, so multiply the full year earnings by 4.

df['tvalue'] = 4 * df.esp * df.pe * df.totals   # Calculate total market value, add new column tvalue
np.sum(df.pe * df.tvalue) / df.tvalue.sum() # Calculation of weighted pe with market capitalisation as the weighting

在这里插入图片描述 The above calculation reflects the market-weighted pe after a particular quarterly report and the result differs from the true market value. This is because stocks have different returns each quarter and therefore you cannot simply calculate the full year return on a "4*single quarter return" basis.

China's stock market is now divided into Shanghai (stock code beginning with 60), Shenzhen Main Board (stock code beginning with 00), GEM (stock code beginning with 30) and the newly listed STB (stock code beginning with 68). The following codes can be used to calculate the pe value and the number of stocks in different sectors.

df['board'] = df.index.str[:2] # take first 2 characters of code, add new board column
# count pe averages by board type, count
df.groupby('board').pe.agg([('pe均值', 'mean'), ('股票数', 'count')])

在这里插入图片描述

· 4 Minutes to read
Allen Ma

The main content of this article is excerpted from Chapters 8 and 10 of the textbook Fundamentals of python Programming, edited by Xueling Zhong and Li Li and published in December 2019 by Electronic Industry Press.

Tushare Financial Data Interface

Installation

The Tushare website is a free and suitable financial data platform for Python developers. The platform can provide financial data covering many categories of data such as China's macro economy, various indices of the domestic stock market, stock trading data of domestic listed companies, regular financial reports of listed companies and domestic financial news. Tushare official website: http://tushare.org

pip install tushare -i https://pypi.tuna.tsinghua.edu.cn/simple#Installation
pip install BeautifulSoup4 -i https://pypi.tuna.tsinghua.edu.cn/simple
pip install openpyxl -i https://pypi.tuna.tsinghua.edu.cn/simple
pip install mplfinance -i https://pypi.tuna.tsinghua.edu.cn/simple

在这里插入图片描述 The data returned by Tushare's built-in functions are all of the DataFrame type of Pandas, so it is easier to manipulate the data returned by these functions using the manipulation tools provided by Pandas, NumPy, Matplotlib and other packages.

Platform common interface call testing

Tushare is divided into ordinary interface and pro user interface. The ordinary interface can be used directly without registration, for example, using the ts.get_gdp_year() function of the ordinary interface to obtain Gross Domestic Product (GDP) data.

import tushare as  ts
df=ts.get_gdp_year()
df.head()

在这里插入图片描述 Return Value Description:

ParameterExplanation
yearyear
gdpGross Domestic Product (billion yuan)
pc_gdpGross domestic product per capita ($)
gnpGross national product (billion yuan)
piPrimary sector (billion yuan)
siSecondary industry (billion yuan)
industryIndustry ($bn)
cons_industryConstruction (billions of yuan)
tiTertiary sector (billions of yuan)
trans_industryTransportation, storage, post and telecommunications (billion yuan)
lbdyWholesale, retail trade and restaurants (billion yuan)

Registering the pro interface

Tushare's normal interface can be used directly without registration, but less data, the more advanced pro interface requires the user to register with the platform https://tushare.pro/register and set up user credential information in the runtime environment before before the pro interface can be used and more data can be downloaded. The process consists of 7 steps as follows.

(1) Login to the webpage https://tushare.pro/register and register as a Tushare community user.

(2) Login to the Tushare community at https://tushare.pro/login and then perform the following three steps to retrieve the user credentials: First, after logging in successfully, move your mouse to the user name in the top right corner of the page and click on the The user can then access the "User Centre" by clicking on the "Personal Home" option in the drop-down menu. The user will then click on the "Interface TOKEN" tab on the "User Centre" page as follows. Finally, click on the copy icon on the right hand side (circled in red) to copy the entire contents of the text box.

在这里插入图片描述 在这里插入图片描述 (3) Use the command pip install tushare to install the Tushare package locally.

(4) Execute the import tushare package command import tushare as ts in the IPython operator interface.

(5) Use the built-in function set_token() of the Tushare package to set the token credential information of the local user in the following way, where the credential information should be represented as a string. ts.set_token("user tushare token")

(6) Initialise the pro interface with the command pro = ts.pro_api(). If set_token('user tushare token') is not valid or you do not want to save the token locally, then you can set token: pro_api('user token') directly when initialising the interface.

(7) Data retrieval. After completing the first 6 operations, the user can only call the pro interface function to get the corresponding data.

pro interface call test

The operation of the pro interface function for obtaining daily stock quotes is as follows.

import tushare as  ts
pro = ts.pro_api('用户tushare token')
df = pro.daily(ts_code = '600104.SH', start_date = '20000501', end_date = '20200917')
df.head()

在这里插入图片描述

· 7 Minutes to read
Allen Ma

Macroeconomic data

A wide range of domestic macroeconomic data can be obtained from the Tushare platform using Tushare's built-in functions, such as money supply, reserve requirement ratio, deposit and loan rates, GDP, consumer price index and ex-factory industrial price index for multiple periods.

在这里插入图片描述

Money supply

The ts.get_money_supply() function allows you to obtain data on our money supply for each of the last 30 years.

import tushare as  ts
df = ts.get_money_supply()
df.head()
df.columns

在这里插入图片描述 Return value description.

ParameterExplanation
monthStatistics time
m2Monetary and quasi-monetary (broad money M2) (billion yuan)
m2_yoyMonetary and quasi-monetary (broad money M2) year-on-year growth (%)
m1Money (Narrow Money M1) (billions of yuan)
m1_yoyMoney (narrow money M1) year-on-year growth (%)
m0Cash in circulation (M0) ($bn)
m0_yoyCash in circulation (M0) year-on-year growth (%)
cdDemand deposits ($bn)
cd_yoyDemand deposits growth (%)
qmQuasi-currency ($bn)
qm_yoyQuasi-currency growth (%)
ftdTime deposits ($bn)
ftd_yoyYear-on-year growth in time deposits (%)
sdSavings deposits ($bn)
sd_yoySavings deposits growth (%)
restsOther deposits ($bn)
rests_yoyYear-on-year growth in other deposits (%)

Deposit rates and loan rates

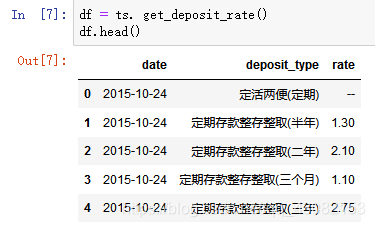
Tushare provides corresponding interface functions for different types of interest rates in order for developers to obtain the required interest rate data. The deposit rate function get_deposit_rate() and the loan rate function get_loan_rate() can be used to obtain the deposit rate and loan rate data issued by the People's Bank of China since 1989 respectively.

import tushare as  ts
df = ts. get_loan_rate()
df.head()

在这里插入图片描述 在这里插入图片描述

Shibor Rate

The Shanghai Interbank Offered Rate (Shibor) is the arithmetic average of the RMB interbank offered rates calculated and determined by a quotation group of banks with high credit ratings, using the National Interbank Offered Rate Centre in Shanghai as the technical platform to calculate, publish and name the rate.

import tushare as  ts
pro = ts.pro_api('用户tushare token')
df=pro.shibor()
df.head()

在这里插入图片描述 Other interest rate pro interface functions. (1) pro.shibor_quote():Shibor quoted data (2) pro.shibor_lpr():LPR lending base rate (3) pro.libor():LIBOR (4) pro.Hibor():Hong Kong Interbank Offered Rate

Stock Quote Data

From the Tushare platform, users can access the stock trading data of all listed companies on the Shanghai Stock Exchange and Shenzhen Stock Exchange, as well as the data of various stock indices (e.g. SSE Composite Index, SZSE Component Index, GEM Index, CSI 300 Index and SMB Index, etc.) of these two markets. The following commands can be executed in sequence to obtain historical daily ticker data for stock code 600848.

import  tushare  as  ts
df = ts.get_hist_data('600848', ktype = 'D')
df.head()

在这里插入图片描述在这里插入图片描述 Return value description.

ParameterExplanation
dateDate
openOpening price
highHighest price
closeClosing price
lowLowest price
volumevolume
price_changeprice change
p_changeprice_change
ma55-day average
ma1010 Day Average
ma2020 Day Average
v_ma55-day average volume
v_ma1010 Day Average
v_ma2020 Day Average
turnoverturnover

The Tushare package provides a number of pro interface functions to return historical stock data. Registered users of the platform can use the pro interface functions to obtain stock quotes, but most of the pro interface functions require users to have a certain number of points before they can be called. The operation of the pro interface function to obtain daily stock quotes is as follows.

import tushare as  ts
pro = ts.pro_api()
df = pro.daily(ts_code = '600008.SH', start_date = '20000501', end_date = '20190808')
df.head()

在这里插入图片描述 There are some structural differences between the quotation data obtained with the pro interface function pro.daily() and the quotation data obtained with the get_hist_data() function. The return data from the pro.daily() function uses the default index, with the date of the transaction as a field (column) data item, whereas the return data from the get_hist_data() function uses the date of the transaction as an index. Given that the structure of the data returned by the different interface functions differs to a greater or lesser extent, it is important to design programs that process this data in such a way that the appropriate processing method is chosen based on the structure of the data returned, or that the data items returned are modified as necessary to meet the formatting requirements of other data processing statements.

在这里插入图片描述 Tushare also provides real-time data on stock trading quotes, i.e. data on the prices of stocks that are being traded on that day. For example, the real time stock trading data obtained through the get_realtime_quotes() function can include information such as the list of quotes and transaction prices of the stock at the current moment, the five buy quotes and five sell prices and other data items, with a total of more than 30 items of information. The operation process is as follows.

import tushare as  ts
df = ts.get_realtime_quotes('300274')
df[['code','name','price','bid','ask','volume','amount','time']]

在这里插入图片描述 Partial return value description.

ParameterExplanation
codeStock code
nameName of the stock
priceCurrent price
highToday's high price
lowToday's low price
bidThe bid price, i.e. "buy one" offer
askbid to sell, i.e. "sell one" offer
volumevolume maybe you need do volume/100 amount, amount traded ($ CNY)

Fundamental data of listed companies

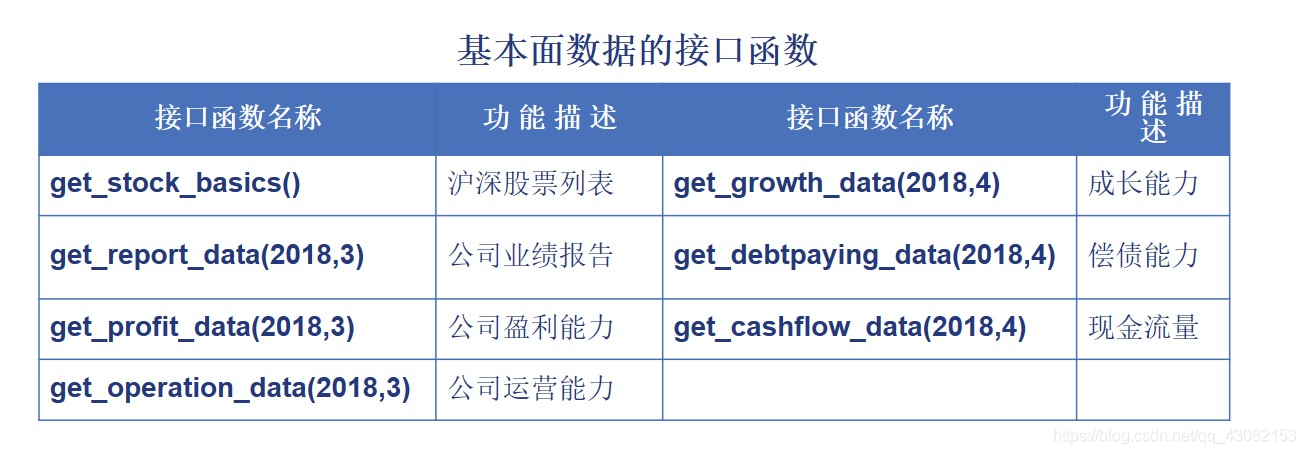
The Tushare platform provides fundamental data on listed companies, including financial position, profitability, market share, management structure, talent composition and more. In addition to stock price data, financial analysts often need fundamental data on listed companies to understand the value of a company's investment. Tushare provides the interface functions for listed companies' fundamental data as shown in the table. 在这里插入图片描述

Stock Index Data

A stock index is a composite price value of stocks compiled by a stock exchange or financial services institution that reflects the price movements of a particular group (class) of stocks.

Stock exchanges and some financial services institutions have compiled and publicly released dozens of stock price indices, and stock investors are accustomed to using stock indices as an observational indicator of stock market price movements.

The pro.index_basic () function can be used to obtain the various stock indices published by the SSE.

import  tushare  as  ts
pro = ts.pro_api('用户tushare token')
df = pro.index_basic(market = 'SSE')
df.head()

在这里插入图片描述 The following two tables list the input and output parameters of the Tushare platform pro version interface function index_basic().

在这里插入图片描述 在这里插入图片描述 在这里插入图片描述

· 2 Minutes to read
Allen Ma

Origins

When I was using a SQL database as a data source, I found that I was getting mostly time series data, and I really wanted to draw line graphs with time as the horizontal coordinate. I wanted the freedom to set the time interval, and the canvas size.

import matplotlib.pyplot as plt
import pandas as pd
import pymssql
import warnings
from pylab import *
import matplotlib.dates as mdates

warnings.filterwarnings('ignore')

connect = pymssql.connect('IP地址','用户名','密码','数据库名')
print("连接成功")
data = pd.read_sql("select TRADEDATE,cast(TCLOSE as int) from TQ_QT_SKDAILYPRICE where SECODE='2010000512'", con=connect)
#print(data.head()) #View the results of the reading
data.columns = ['day','close']
#print(data.head()) #View the results of the reading
data['day'] = pd.to_datetime(data['day']) #Convert to date, otherwise the date settings below will not work

#The matplotlib.pyplot approach
plt.rcParams['font.family'] = ['sans-serif']
plt.rcParams['font.sans-serif'] = ['SimHei']

fig = plt.figure(figsize=(20, 5))
ax = fig.add_subplot(1, 1, 1)

plt.gca().xaxis.set_major_formatter(mdates.DateFormatter('%Y-%m')) #Set the format of the x-axis main scale display (date)
plt.gca().xaxis.set_major_locator(mdates.MonthLocator(interval=15)) #Set the x-axis main scale interval

plt.xlabel('日期')
plt.ylabel('收盘价')
plt.title('2010000512收盘价折线图')
plt.plot(data['day'],data['close'])
plt.show()

Results of the run. 在这里插入图片描述

Adjust the canvas size

fig = plt.figure(figsize=(20, 5))

20 and 5 are the length and width of the canvas respectively.

Control the normal display of Chinese characters and plus and minus signs

plt.rcParams['font.family'] = ['sans-serif']
plt.rcParams['font.sans-serif'] = ['SimHei']

Set the x-axis master scale display format (date)

import matplotlib.dates as mdates
plt.gca().xaxis.set_major_formatter(mdates.DateFormatter('%Y-%m'))

'%Y-%m' can be freely selected from '%y-%m-%d %H:%M'. The year, month, day, hour and minute are displayed respectively.

Set x-axis main scale spacing

import matplotlib.dates as mdates
plt.gca().xaxis.set_major_locator(mdates.MonthLocator(interval=15))

Change the sparsity of the horizontal labels by changing the size of the interval assignment. The larger the interval, the more sparse it is.

· 3 Minutes to read
Allen Ma

Problems identified

When I was writing the article Financial Data Analysis (I) python previewThe following error was reported for Project 2: Calculating the annual growth rate of mobile phone sales.在这里插入图片描述 It looks like the results have been run, but the long string in front of it is really uncomfortable to watch. This, coupled with the fact that ==Process finished with exit code 1== makes me even more convinced that there is something fishy going on here.

As shown in the diagram, the error message is

Traceback (most recent call last):
IndexError: list index out of range

Find out why

After searching for information on the subject I learned that there are two main reasons why list index out of range errors occur.

One possibility is that the subscript is out of range. one could be that the list is empty, without a single element

Let me next illustrate this abstraction with an example. Open idle and enter the following code

>>> li = [1,2,3,4,5,6,7,8,9,10]
>>> #Index[0,1,2,3,4,5,6,7,8,9 ]
>>> li[8]
9
>>> li[10]
Traceback (most recent call last):
File "<pyshell#3>", line 1, in <module>
li[10]
IndexError: list index out of range
>>> # Like this, the index value is out of the loop, also called out of bounds

Trying to solve

First attempt to solve. Add the try... .except module

for s in linestr:
try:
L = s.split('\t')
print(L[0], end=" ")
print(isBigGrowth(L, 0.3))
except:
print('运行失败')

Results of the run: 在这里插入图片描述As you can see, the headache-inducing red error message is gone, and ==Process finished with exit code 0== The problem seems to have been solved, but we know that this is only superficial and that the problem has not been solved, but we have chosen not to display it. The cure is not the cause!

Second attempt to resolve. I noticed that the program was throwing an exception at the last entry. The mobile company is able to analyse and determine all of them, so could it be the second cause of the error? There was the empty list. So I checked the source documentation and found that there was indeed an empty line at the end. 在这里插入图片描述 After removing the blank line at the end, run the program again: 在这里插入图片描述 Now that's perfect! Comfortable =。=

Summary

It is very important to check the format of the data being analysed before processing it!

· 1 Minutes to read
Allen Ma

Visual computing is an important part of data analysis, especially the module matplotlib.

Recently a new generation of plotting module plotly has come out of nowhere and has a definite advantage in terms of interactivity. However, it is still easier to plot some simple images using matplotlib.

In 2017 matplotlib 2.0 was released, offering six plotting styles for users to choose from.

'bmh','dark_background','fivethirtyeight','ggplot','grayscale','default'

Different integrated environments can increase the number of matplotlib plotting styles to over 20. These methods can be applied directly to pandas' plotting statements.

The image is plotted using the pandas data analysis module's built-in plot command, with the following code.

#coding=utf-8
'''
Created on 2020.09.29
'''
import matplotlib.pyplot as plt
import pandas as pd

def dr_xtyp(_dat):
#xtyp=['bmh','dark_background','fivethirtyeight','ggplot','grayscale','default']
for xss in plt.style.available:
plt.style.use(xss);print(xss)
_dat['Open'].plot()
_dat['Close'].plot()
_dat['High'].plot()
_dat['Low'].plot()
fss="tmp\\stk001_"+xss+"_pd.png";plt.savefig(fss)
plt.show()

# =======================
df = pd.read_csv('dat\\appl2014.csv',index_col=0,parse_dates=[0],encoding='gbk')

d30=df[:30]
dr_xtyp(d30)

Results of the run.

在这里插入图片描述 A variety of different styles of images will be produced in the tmp directory.

在这里插入图片描述