· 5 Minutes to read
Allen Ma

Case (5) Analysis of specific financial data

Project I.

Case details

Mr. Wang, a senior engineer in a high-tech company, recently plans to purchase a home in Guangzhou with a total price of RMB 10 million. He is unable to pay in full due to his own limited funds and intends to apply for a home mortgage loan from the local Bank C. Assuming that you are the account manager of Bank C responsible for expanding the housing mortgage loan business, after assessing Mr. Wang's repayment ability, you formulate the following loan proposal: the principal amount of the loan is RMB 6 million, the loan term is 30 years, and the interest rate of the loan is 5 basis points above the market quoted rate (LPR) for loans of 5 years or more, i.e. the loan interest rate is 4.9%. However, for this loan there are two repayment options available to Mr. Wong as follows. (1) Equal principal and interest repayment, which specifically means that the sum of the monthly repayment of principal and interest for Mr. Wong as a borrower remains the same while the interest rate level of the loan remains unchanged. (2) Equal principal repayment, which specifically means that Mr. Wang's monthly principal repayment is fixed and the interest paid decreases each month while the interest rate level of the loan remains the same. To give Mr. Wang a clear understanding of the differences between these two repayment methods and to demonstrate the loan repayments with the help of a graph, you need to complete 3 programming tasks using Python.

Programming tasks

(1) Assuming that you have chosen equal principal and interest repayment, calculate the amount that Mr. Wang needs to repay each month, as well as the principal and interest amounts of the monthly repayment, and visualise the relevant data. (2) In order to show Mr Wong the effect of a change in the interest rate on the monthly repayment amount under the equal principal rule, you use the following sensitivity analysis: that is, you model and visualise the change in Mr Wong's monthly repayment amount when the interest rate on the loan increases from 2%/year to 8%/year. (3) Assuming that the equal principal repayment rule is applied and the loan interest rate remains at 4.9%/year, calculate the principal and interest components of Mr. Wong's monthly repayments separately and visualise the results.

Start programming.

# -*- coding: utf-8 -*-
"""
Created on Tue Sept 22 8:47:37 2020

@author: mly
"""
import numpy as np
import matplotlib.pyplot as plt

# (1)
dp_rate = 0.049 # Loan Rates
loan_pv = 6000000 # Principal amount of loan Unit: $
loan_year = 30 # Loan term (years)
repay_mon = -round(np.pmt(dp_rate / 12, loan_year * 12, loan_pv)) # Monthly Repayment Amount
interestList = [] # List of interest per instalment
capitalList = [] # List of principal repayments required per instalment
monthList = [x for x in range(loan_year * 12)] # List of repayment periods
rest = loan_pv #Defining the remaining principal repayment in lieu
for i in range(loan_year * 12):
interest = round(rest * (dp_rate / 12)) # Interest per instalment
interestList.append(interest) # Insert the interest for each period into the list of interest
repay_capital = repay_mon - interest # Principal amount to be repaid per instalment
capitalList.append(repay_capital) # Insert the principal amount to be repaid for each period into the list of principal amounts to be repaid
rest = round(rest - repay_capital) # Principal remaining to be repaid
# Plotting stacked bar charts
plt.rcParams['font.sans-serif'] = ['SimHei']
plt.rcParams['axes.unicode_minus'] = False #Show Chinese
plt.bar(monthList, capitalList, align="center", color="#EE9A49", label='每月本金额')
plt.bar(monthList, interestList, align="center", bottom=capitalList, color="#000000", label='每月利息额')
plt.xlabel('还款期限(月)')
plt.ylabel('每月还款额(元)')
plt.title('等额本息还款图')
plt.legend()
plt.show()

#(2)
# Sensitivity analysis of 2% to 8% p.a.
rates = [x / 100 for x in range(2, 9, 1)] # Loan APR
repaymentNL = []
for n in range(len(rates)):
repaymentN = -round(np.pmt(rates[n] / 12, loan_year * 12, loan_pv)) # Monthly Repayment Amount
repaymentNL.append(repaymentN)
plt.plot(rates, repaymentNL, lw=6,color="#EE9A49", label="每月还款额")
plt.fill_between(rates, 0, repaymentNL, facecolor="#000000", alpha=1)
plt.xlabel('年利率')
plt.ylabel('每月还款额(元)')
plt.title('年利率在2%~8%变化时每月还款额变化趋势')
plt.legend()
plt.show()

# Equal principal
repay_capitalX = loan_pv / (loan_year * 12) # Principal amount of each repayment in equal instalments
repay_capitalXL = [repay_capitalX for i in range(loan_year * 12)]
restX = loan_pv # Initial principal to be repaid
interestXList = [] # List of interest per instalment
repaymentXL = [] # List of principal repayments required per instalment
for i in range(loan_year * 12):
interestX = round(restX * (dp_rate / 12)) # Interest per instalment
interestXList.append(interestX) # Insert the interest for each period into the list of interest
restX = round(restX - repay_capitalX) # Principal remaining to be repaid
repaymentX = interestX + repay_capitalX # Repayment amount per instalment
repaymentXL.append(repaymentX)
# Plotting stacked bar charts
plt.rcParams['font.sans-serif'] = ['SimHei']
plt.rcParams['axes.unicode_minus'] = False
plt.plot(monthList, repaymentXL)
plt.bar(monthList, repay_capitalXL, align="center", color="#000000", label='每期本金额')
plt.bar(monthList, interestXList, align="center", bottom=repay_capitalXL, color="#EE9A49", label='每期利息额')
plt.xlabel('还款期限(月)')
plt.ylabel('每期还款额(元)')
plt.title('等额本金还款图')
plt.legend()
plt.show()

Presentation of results

Equal Interest Repayment Chart Trend in monthly repayments as the APR varies from 2% to 8% Equal principal repayment chart

· 1 Minutes to read
Allen Ma

Case (4) Analysis of macro-financial data

Project 2: Analysis of changes in access to basic public health services for rural versus urban residents in China over the past 25 years (chart output)

Using World Bank public data

# -*- coding: utf-8 -*-
"""
Created on Mon Sept 21 8:04:59 2020

@author: mly
"""
import matplotlib.pyplot as plt
import matplotlib as mpl
import numpy as np
import pandas as pd
from matplotlib import ticker

plt.rcParams['font.sans-serif'] = ['SimHei']
mpl.rcParams["axes.unicode_minus"] = False

df = pd.read_csv('basicsanit_china2000to2017.csv')

y = df['rural_sanit']
y1 = df['urban_sanit']
y2 = df['peopl_sanit']
x = df['year']

plt.figure()
ax = plt.gca()
plt.grid(axis="y")
plt.title('农村居民与城市居民享受基本公共卫生服务的变化情况')
plt.ylabel('服务数值')
plt.xlabel('年份')
ax.plot(x, y, '-rp', lw = 1.5, label = 'rural_sanit')
ax.plot(x, y1, '-gp', lw = 1.5, label = 'rural_sanit')
ax.plot(x, y2, '-bp', lw = 1.5, label = 'peopl_sanit')
ax.legend(loc = 'upper right')

plt.show()

Results of the run.

在这里插入图片描述

· 2 Minutes to read
Allen Ma

Case (4) Macro-financial data analysis

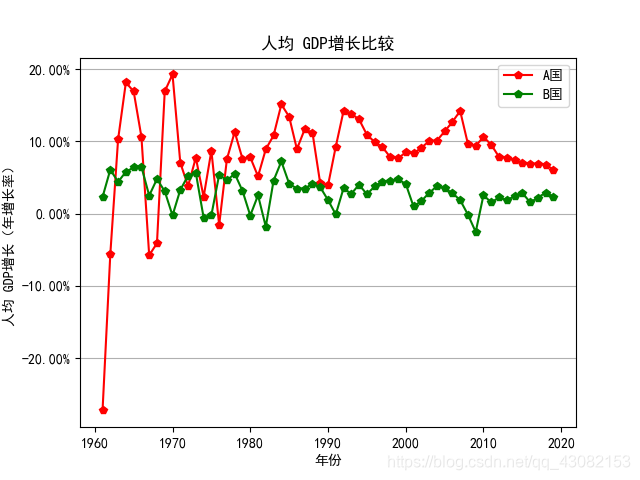
Project 1: Comparison of GDP per capita growth rates between country A and country B over the last 40 years using macroeconomic data provided by the World Bank Open Data Platform (graphical output)

The data is available via the download link in this webpage: https://data.worldbank.org.cn/?locations=CN-US

在这里插入图片描述

# -*- coding: utf-8 -*-
"""
Created on Mon Sept 22 9:11:59 2020

@author: mly
"""
import matplotlib.pyplot as plt
import matplotlib as mpl
import numpy as np
import pandas as pd
from matplotlib import ticker

plt.rcParams['font.sans-serif'] = ['SimHei']
mpl.rcParams["axes.unicode_minus"] = False

df = pd.read_csv('gdpchinaseries.csv')
df2 = pd.read_csv('gdpusaseries.csv')
y = df['gdp']
y1 = df2['gdp']
x = [x for x in range(1961,2020)]

ymajorFormatter = ticker.FormatStrFormatter('%.2f%%') # Set the format of the y-axis label text

plt.figure()
ax = plt.gca()
plt.grid(axis="y")
plt.title('人均 GDP增长比较')
plt.ylabel('人均 GDP增长(年增长率)')
plt.xlabel('年份')
ax.yaxis.set_major_formatter(ymajorFormatter) # Show percentage
ax.plot(x, y, '-rp', lw = 1.5, label = 'A国')
ax.plot(x, y1, '-gp', lw = 1.5, label = 'B国')
ax.legend(loc = 'upper right')


plt.show()

Results of the run.

在这里插入图片描述

· 2 Minutes to read
Allen Ma

Case (3) Simple financial data analysis

Project 3: Calculate the return generated by trading stocks with the MACD indicator buy-sell signal over a one-year period

A program is designed to calculate the return generated by trading stocks with the MACD indicator buy and sell signals over a period of one year. The MACD trading signals are: a fast line crossing the slow line from bottom to top is a buy signal for that day, and a fast line crossing the slow line from top to bottom is a sell signal for that day. Assume that the buy and sell prices are the closing prices on the day of the trade signal.

# -*- coding: utf-8 -*-
"""
Created on Sun Sept 20 9:04:59 2020

@author: mly
"""
import numpy as np
import datetime
import pandas_datareader.data as web

start = datetime.datetime(2018, 6, 1)
end = datetime.datetime.today()
stock_name = '601318.ss'
df = web.DataReader(stock_name, 'yahoo', start, end)


def df_EMA(prices, N):
ema = []
k = len(prices)
if k > 0:
for i in range(k):
if i == 0:
ema.append(prices[i])
else:
ema.append((2 * prices[i] + (N - 1) * ema[i - 1]) / (N + 1))
return (ema)


def df_MACD(df, short=12, long=26, M=9):
fast = df_EMA(df['Adj Close'].values, short)
slow = df_EMA(df['Adj Close'].values, long)
if len(fast) > 0: # & len(slow)>0:
df['Fast'] = np.round(np.array(fast), 2)
df['Slow'] = np.round(np.array(slow), 2)
df['DIF'] = df['Fast'] - df['Slow']
df['DEA'] = np.round(np.array(df_EMA(df['DIF'].values, M)), 2)
df['MACD'] = 2 * (df['DIF'] - df['DEA'])
df['tim'] = df['Close'] / df['Open']
return (df)
else:
print('no data,no MACD')


times0 = 1
marker = 0
df_MACD(df, 12, 26, 9)
for i in df.itertuples(index=True, name='df'):
if getattr(i, 'DIF') > 0 and marker == 0:
times0 = times0 * getattr(i, 'tim')
marker = 1
elif getattr(i, 'DIF') > 0 and marker == 1:
times0 = times0 * getattr(i, 'tim')
marker = 1
elif getattr(i, 'DIF') == 0 and marker == 1:
times0 = times0 * getattr(i, 'tim')
marker = 0
elif getattr(i, 'DIF') < 0 and marker == 1:
times0 = times0 * getattr(i, 'tim')
marker = 0
else:
continue

print(times0)

Results of the run.

在这里插入图片描述 It seems that historically if you follow this method of buying shares, at least you won't lose qwq,23333333333...

· 3 Minutes to read
Allen Ma

Case (3) Simple financial data analysis

Project 2: Calculating the excess return of a stock

Design a program to calculate the quarterly and annual returns of a stock and to calculate the excess return (i.e. relative return) of a single stock's return relative to the average stock market return over the same period.

This project uses tushare's Python SDK to obtain the data The details of the methodology are the subject of a new article.

# -*- coding: utf-8 -*-
"""
Created on Sat Sept 19 9:30:36 2020

@author: mly
"""
import tushare as ts
import numpy as np
import pandas as pd
import matplotlib.pyplot as plt
from matplotlib import ticker

plt.rcParams['font.sans-serif'] = ['SimHei'] # Used to display Chinese labels properly

startday = '2015-01-01'
endday = '2020-04-01'
tscode = '600519'
tsindx = 'sh'
df1 = ts.get_k_data(tscode, start = startday, end = endday, ktype = 'M')
df2 = ts.get_k_data(tsindx, start = startday, end = endday, ktype = 'M')
df1.to_excel('600519.xlsx',index=False)
df2.to_excel('sh.xlsx',index=False)
df1=pd.read_excel('600519.xlsx',dtype={'code':'str'})
df2=pd.read_excel('sh.xlsx',dtype={'code':'str'})
df = df2[['date', 'close']].copy()
df.rename(columns={'close': 'indclose'}, inplace = True)
df = pd.merge(df[['date', 'indclose']],
df1[['date', 'close']], on = 'date', how = 'left')
df.fillna(method = 'ffill',inplace=True) #successively to the filling
df.fillna(method = 'bfill',inplace=True) # Further forward filling
# Calculating monthly and cumulative rates of return
df['stk_log_ret'] = np.round(np.log(df['close']/df['close'].shift(1)), 4)
df['ind_log_ret'] = np.round(np.log(df['indclose']/df['indclose'].shift(1)), 4)
df['stk_log_ret'].fillna(method = 'bfill',inplace=True) # Further forward filling
df['ind_log_ret'].fillna(method = 'bfill',inplace=True) # Further forward filling
df['xd_ret']=df['stk_log_ret']-df['ind_log_ret']
df['xd_ret'].fillna(method = 'bfill',inplace=True) # Further forward filling

df_list=list(df['stk_log_ret'].values)
print(df['stk_log_ret'].values)

ret_year=[]
ret_quarter=[]
for i in range(len(df_list)//3):
ret_quarter.append(np.round(df_list[3*i]+df_list[3*i+1]+df_list[3*i+2],4))
ret_quarter1=pd.Series(ret_quarter)

for n in range(len(ret_quarter)//4):
ret_year.append(np.round(ret_quarter[4*n]+ret_quarter[4*n+1]+ret_quarter[4*n+2]+ret_quarter[4*n+3],4))
ret_year1=pd.Series(ret_year)

quarter_list=[]
year=[]
df_index=list(df.date)
for value in df_index:
tempvalue = value.split("-")
if tempvalue[1] in ['01','02','03']:
quarter_list.append(tempvalue[0] + "Q1")
year.append(tempvalue[0])
elif tempvalue[1] in ['04','05','06']:
quarter_list.append(tempvalue[0] + "Q2")
year.append(tempvalue[0])
elif tempvalue[1] in ['07', '08', '09']:
quarter_list.append(tempvalue[0] + "Q3")
year.append(tempvalue[0])
elif tempvalue[1] in ['10', '11', '12']:
quarter_list.append(tempvalue[0] + "Q4")
year.append(tempvalue[0])

quarter_set = set(quarter_list)
quarter_list = list(quarter_set)
quarter_list.sort()

year_set = set(year)
year = list(year_set)
year.sort()
year.pop() #Delete as 2020 is not yet complete

ymajorFormatter = ticker.FormatStrFormatter('%.2f%%') # Formatting of axis label text

fig = plt.figure(figsize=(14, 24))
ax1 = fig.add_subplot(3, 1, 1)
fig.subplots_adjust(bottom = 0.2)
plt.ylabel('季度收益率')
plt.xticks(rotation = 60)
ax1.yaxis.set_major_formatter(ymajorFormatter) # Show percentage
ax1.plot(quarter_list, ret_quarter1*100, '-cs', lw = 1.5, label = tscode+' 季度收益率')
ax1.legend(loc = 'upper left')

ax2 = fig.add_subplot(3, 1, 2)
plt.ylabel('年收益率')
plt.xticks(rotation = 60)
ax2.yaxis.set_major_formatter(ymajorFormatter) # 显示百分比
ax2.plot(year, ret_year1*100, '-gp', lw = 1.5, label = tscode+' 年收益率')
ax2.legend(loc = 'upper left')

ax3 = fig.add_subplot(3, 1, 3)
plt.ylabel('相对收益率')
plt.xticks(rotation = 60)
ax3.yaxis.set_major_formatter(ymajorFormatter) # 显示百分比
ax3.plot(df.date, df['xd_ret']*100, '-rp', lw = 1.5, label = tscode+' 相对市场收益率')
ax3.legend(loc = 'upper left')
plt.show()

Results of the run.

在这里插入图片描述

· 2 Minutes to read
Allen Ma

Case (3) Simple financial data analysis

Design a program to compare the trends in the respective total repayments for the same loan amount (e.g. RMB 1 million) but different mortgage (monthly) amounts (calculate at least three mortgage amounts).

# -*- coding: utf-8 -*-
"""
Created on Fri Sept 18 9:50:37 2020

@author: mly
"""
import numpy as np
import matplotlib.pyplot as plt
plt.rcParams['font.sans-serif'] = ['SimHei'] # Used to display Chinese labels properly

dp_rate = 0.015 # 1-year deposit rate issued by PBoC in October 2015
rates = [0.046, 0.05, 0.054] # 2, 4 and 6 year loan rates
loan_pv = 100 # Unit: million
loan_nper = [2, 4, 6] # Unit: Year
repay_pmt = np.zeros(len(loan_nper)) # Mortgage Monthly Payment Amount
repay_fv = np.zeros(len(loan_nper)) # Actual future final value of repayments
for n in range(len(loan_nper)):
repay_pmt[n] = round(np.pmt(rates[n]/12, loan_nper[n]*12, loan_pv)*10000, 2)
repay_fv[n] = round(np.fv(dp_rate/12, loan_nper[n]*12, repay_pmt[n], 0), 2)

fig, ax = plt.subplots(figsize = (9,6))
ax.plot(loan_nper, np.round(repay_fv/10000, 2), marker= 'o', label = '不同还款年限的按揭终值')
ax.set(xticks = loan_nper, xlabel = '还款年限', ylabel = '100 万按揭终值')
for i in range(len(loan_nper)):
ax.text(loan_nper[i], np.round(repay_fv/10000, 2)[i],
np.round(repay_fv/10000, 2)[i], ha='left', fontsize=20)
ax.legend()
plt.show()

Results of the run.

在这里插入图片描述

· 2 Minutes to read
Allen Ma

Case (II) crawler warm-up

Project two: Amazon product information custom acquisition, customizable product name and crawl page number

# -*- coding: utf-8 -*-
"""
Created on Thur Sept 17 15:56:36 2020

@author: mly
"""
import requests
import re
import pandas as pd

ilt = []
iltl = []


def getHTMLText(url):
try:
kv = {'user-agent': 'Mozilla/5.0',
'Cookie': 'x-wl-uid=1+EeiKz9a/J/y3g6XfXTnSbHAItJEus3oQ6Gz+T/haur7dZfkNIgoxzMGwviB+42iWIyk9LR+iHQ=;'
' session-id=457-2693740-8878563; ubid-acbcn=459-5133849-3255047; lc-acbcn=zh_CN; i18n-prefs=CNY; '
'session-token="8n/Oi/dUCiI9zc/0zDLjB9FQRC6sce2+Tl7F0oXncOcIYDK4SEJ7eek/Vs3UfwsRchW459OZni0AFjMW+'
'9xMMBPSLM8MxLNDPP1/13unryj8aiRIZAE1WAn6GaeAgauNsijuBKKUwwLh8Dba7hYEjwlI1J6xlW0LKkkyVuApjRXnOsvdYr'
'X8IURVpOxDBnuAF9r7O71d/NPkIQsHy7YCCw=="; session-id-time=2082787201l;'
' csm-hit=tb:s-85XYJNXFEJ5NBKR0JE6H|1566558845671&t:1566558845672&adb:adblk_no'}
r = requests.get(url, headers=kv, timeout=30)
r.raise_for_status()
r.encoding = r.apparent_encoding
return r.text
except:
return ""


def parsePage(ilt, html):
try:
plt = re.findall('<span class="a-offscreen">¥(.*?)</span>', html)
#print(plt)
tlt = re.findall('<span class="a-size-base-plus a-color-base a-text-normal" dir="auto">(.*?)</span>', html)
#print(tlt)
for i in range(len(tlt)):
ilt.append([plt[i], tlt[i]])
except:
return ""


def printGoodsList(ilt):
column = ["序号", "价格", "商品名称"]
count = 0
for g in ilt:
count = count + 1
iltl.append([count, g[0], g[1]])
test = pd.DataFrame(columns=column, data=iltl)
test.to_csv('finance.csv', encoding='utf_8_sig', index=False)


def main():
goods = input("请输入商品名称:")
depth = int(input("请输入想查看到的页码:"))
start_url = 'https://www.amazon.cn/s?k=' + goods
infoList = []
for i in range(depth):
try:
url = start_url + '&page=' + str(i + 1)
html = getHTMLText(url)
parsePage(infoList, html)
except:
continue
printGoodsList(infoList)

main()

Runs with customisable product names and crawl pages.

在这里插入图片描述 Crawl results.

在这里插入图片描述

· 3 Minutes to read
Allen Ma

Case (II) crawl prep

Project two: crawling stock data using two different methods

Method two: scrapy crawler framework

This case is a crawl of relevant content using the scrapy framework.

Installing the scrapy framework

Open cmd and type the following code to install it.

pip install scrapy

Verify that the installation was successful.

scrapy -h

Create a new Scrapy crawler project

Once scrapy has been successfully installed, continue to create the project by typing the code into the cmd. Switch the directory to the path where you want to create the crawler project and execute.

scrapy startproject baidustocks

Once executed, a series of folders and files such as .py will be created in the directory. 在这里插入图片描述

Generating a Scrapy crawler in a project

Just type a single line of command in cmd, we need to specify the name of the crawler and the website to crawl.

cd baidustocks
scrapy genspider stocks hq.gucheng.com/gpdmylb.html

stocks is the name of the crawler hq.gucheng.com/gpdmylb.html is the site to crawl

A file called stocks.py will be generated when it is done.

Configure the resulting spider crawler

Modify the crawler file to suit your needs. As an example, I will crawl stock data.

# -*- coding: utf-8 -*-

import scrapy
import re
from scrapy.selector import Selector


class StocksSpider(scrapy.Spider):
name = 'stocks'
start_urls = ['https://hq.gucheng.com/gpdmylb.html']

def parse(self, response):
for href in response.css('a::attr(href)').extract():
try:
stock = re.search(r'S[HZ]\d{6}/', href)
url = 'https://hq.gucheng.com/' + stock.group()
yield scrapy.Request(url, callback=self.parse_stock)
except:
continue

def parse_stock(self, response):
infoDict = dict()
stockInfo = response.css('.stock_top').extract()[0]
stockprice = response.css('.s_price').extract()[0]
stockname = response.css('.stock_title').extract()[0]
stockname = Selector(text=stockname)
stockprice = Selector(text=stockprice)
stockInfo = Selector(text=stockInfo)
infoDict['名字'] = re.search(r'>(.*?)</h1>', stockname.css('h1').extract()[0]).group(1)
infoDict['编号'] = re.search(r'>(.*?)</h2>', stockname.css('h2').extract()[0]).group(1)
infoDict['状态'] = re.search(r'>(.*?)</em>', stockname.css('em').extract()[0]).group(1)
infoDict['时间'] = re.search(r'>(.*?)</time>', stockname.css('time').extract()[0]).group(1)
price = stockprice.css('em').extract()
infoDict['股价'] = re.search(r'>(.*?)</em>', price[0]).group(1)
infoDict['涨跌额'] = re.search(r'>(.*?)</em>', price[1]).group(1)
infoDict['涨跌幅'] = re.search(r'>(.*?)</em>', price[2]).group(1)
keylist = stockInfo.css('dt').extract()
valuelist = stockInfo.css('dd').extract()
for i in range(len(keylist)):
key = re.search(r'>(.*?)<', keylist[i], flags=re.S).group(1)
key = str(key)
key = key.replace('\n', '')
try:
val = re.search(r'>(.*?)<', valuelist[i], flags=re.S).group(1)
val = str(val)
val = val.replace('\n', '')
except:
val = '--'
infoDict[key] = val
yield infoDict

Run the crawler and get the data

cmd to execute the following command

scrapy crawl stocks

Wait for the summary information you can see after execution. 在这里插入图片描述

Write Pipelines to process the fetched data

Write pipelines.py file

# Define your item pipelines here
#
# Don't forget to add your pipeline to the ITEM_PIPELINES setting
# See: https://docs.scrapy.org/en/latest/topics/item-pipeline.html


# useful for handling different item types with a single interface
from itemadapter import ItemAdapter


class BaidustocksPipeline:
def process_item(self, item, spider):
return item

class BaidustocksInfoPipeline(object):
def open_spider(self, spider):
self.f = open('BaiduStockInfo.txt', 'w')

def close_spider(self, spider):
self.f.close()

def process_item(self, item, spider):
try:
line = str(dict(item)) + '\n'
self.f.write(line)
except:
pass
return item

Configure the ITEM_PIPELINES option

Write the settings.py file Look for the parameter ITEM_PIPELINES in it and change the following parameters.

在这里插入图片描述

Execute the entire framework

In the cmd.

scrapy crawl stocks

Then we'll wait and be done with it =. =... 在这里插入图片描述 在这里插入图片描述Finish the job!

· 2 Minutes to read
Allen Ma

Case (II) crawl prep

Project two: crawling stock data using two different methods

Method one: requests&bs4&re

import requests
from bs4 import BeautifulSoup
import re


def getHTMLText(url, code="utf-8"):
kv = {
'User-Agent': 'Mozilla/5.0 (Windows NT 10.0; Win64; x64) AppleWebKit/537.36 (KHTML, like Gecko) Chrome/78.0.3904.108 Safari/537.36'}
try:
r = requests.get(url, headers=kv)
r.raise_for_status()
r.encoding = code
return r.text
except:
return ""


def getStockList(lst, stockURL):
html = getHTMLText(stockURL, "GB2312")
soup = BeautifulSoup(html, 'html.parser')
li = soup.find('section', attrs={'class': 'stockTable'})
a = li.find_all('a')
for i in a:
try:
href = i.attrs['href']
lst.append(re.findall(r"[S][HZ]\d{6}", href)[0])
except:
continue


def getStockInfo(lst, stockURL, fpath):
count = 0
for stock in lst:
url = stockURL + stock
html = getHTMLText(url)
try:
if html == "":
continue
infoDict = {}
soup = BeautifulSoup(html, 'html.parser')
stockInfo = soup.find('section', attrs={'class': 'stock_price clearfix'})
mc = soup.find('header', attrs={'class': 'stock_title'})
name = mc.find('h1')
infoDict.update({'股票名称': name.text})

keyList = stockInfo.find_all('dt')
valueList = stockInfo.find_all('dd')
for i in range(len(keyList)):
key = keyList[i].text
val = valueList[i].text
infoDict[key] = val

with open(fpath, 'a', encoding='utf-8_sig') as f:
f.write(str(infoDict) + '\n')
count = count + 1
print("\r当前进度: {:.2f}%".format(count * 100 / len(lst)), end="")
except:
count = count + 1
print("\r当前进度: {:.2f}%".format(count * 100 / len(lst)), end="")
continue


def main():
stock_list_url = 'https://hq.gucheng.com/gpdmylb.html'
stock_info_url = 'https://hq.gucheng.com/'
output_file = 'BaiduStockInfo.csv'
slist = []
getStockList(slist, stock_list_url)
getStockInfo(slist, stock_info_url, output_file)


main()

Projects take a while to run and progress can be viewed via the output desk.

在这里插入图片描述 More than an hour later. The execution was finished A total of 3590 data 在这里插入图片描述

· 2 Minutes to read
Allen Ma

Case (II) crawler preview

Project one: Dangdang online shop product crawler - crawler books as an example

This case is a crawl of relevant content using the bs4 library find method.

 -*- coding: utf-8 -*-
import requests
import csv
from bs4 import BeautifulSoup as bs
#Access to web information
def request_dandan(url):
try:
#User Agents
headers = {'User-Agent': 'Mozilla/5.0 (Windows NT 10.0; Win64; x64) AppleWebKit/537.36 (KHTML, like Gecko) Chrome/80.0.3987.163 Safari/537.36'}
r = requests.get(url,headers=headers)
if r.status_code == 200:
return r.text
except requests.RequestException:
return None

#Storage column name
def write_item_to_file():
csv_file = open('dangdang.csv', 'w', newline='', encoding="utf-8")
writer = csv.writer(csv_file)
writer.writerow(['书名','购买链接','纸质书价格','电子书价格','电子书链接','书的详细介绍','书的封面地址','评论地址','作者','出版时间','出版社'])
print('列名已成功放入CSV中')
#Parsing web pages and writing to csv files
def parse_dangdang_write(html):
csv_file = open('dangdang.csv', 'a', newline='')
writer = csv.writer(csv_file)
#Parsing web pages
soup = bs(html, 'html.parser')
class_tags = ['line'+str(x) for x in range(1,61)]
for class_tag in class_tags:
li = soup.find('li',class_=class_tag)
book_name = li.find('a',class_='pic').get('title') # Book Title
paperbook_price = li.find('span',class_='search_now_price').text #Paperback prices
try:
ebook_price = li.find('a',class_='search_e_price').find('i').text #E-book prices
ebook_link = li.find('a',class_='search_e_price').get('href') #Ebook links
except:
ebook_price = ''
ebook_link = ''
detail = li.find('p',class_='detail').text #Book Details
book_purchase_link = li.find('a',class_='pic').get('href') #Detailed purchase links for each book
book_cover_link = li.find('a',class_='pic').find('img').get('src')#Book cover address
comment_link = li.find('a',class_='search_comment_num').get('href') #Comment Address
author = li.find('p',class_='search_book_author').find('span').text # Author of the book
public_time = li.find('p',class_='search_book_author').find('span').next_sibling.text[2:]#Publication date
public = li.find('p',class_='search_book_author').find('span').next_sibling.next_sibling.text[3:]#Publisher
writer.writerow([book_name, book_purchase_link, paperbook_price, ebook_price, ebook_link, detail, book_cover_link, comment_link, author, public_time, public])
#writer.writerow(['book title', 'buy link', 'paperback price', 'ebook price', 'ebook link', 'book details', 'book cover address', 'review address', 'author', 'publication date', 'publisher'])
csv_file.close()

if __name__ == '__main__':
write_item_to_file()
for page in range(1, 10): # Crawl 9 pages of data into a csv file
url = 'http://search.dangdang.com/?key=python%C5%C0%B3%E6&act=input&page_index=' + str(page)
html = request_dandan(url) # Access to web information
parse_dangdang_write(html) # Parsing web pages and writing to csv files
print('第{}页数据成功放入CSV中'.format(page))

Results of the run. 在这里插入图片描述 在这里插入图片描述