HDD shopping experience
🔨Small gestures
Movement Director @Allen
Creative Stance Statement: This is a short article, and the two websites mentioned here are very informative, so please make use of the directory jump, search function and the "CTRL+F" shortcut.
Hello, I'm Allen, and for those of you looking to buy electronics, whether you're looking to install a computer or play with a NAS, there's no getting around the hard drive. Although the price of SSDs has been dropping year on year, they are still much more expensive than traditional mechanical hard drives. For most friends, SSDs are generally used to install the system, and a lot of data is still stored in the mechanical hard drive. Faced with Blu-ray movies and plays starting at 50 or 100G, 2T and 4T hard drives are already slightly overwhelming. The demand for storage space is growing, but high-capacity mechanical hard drives are not cheap either. Especially for those who play NAS, the money spent on buying hard drives is usually much higher than the price of NAS devices. How exactly do you buy such an expensive hard drive so you don't get screwed?
Preface
机械硬盘(Abbreviations:HDD)As opposed to固态硬盘((Abbreviations:SSD)The three main advantages are capacity, price and stability. You can get a decent 12TB HDD for under 1000, which is a capacity to price ratio that SSDs can't match. So many people, including me, choose to use mechanical HDDs as high-capacity storage drives for things they don't often read or write but are large in size.
Many hard drive manufacturers use SMR technology in order to cut costs and make large capacities, making their lifespan and full disk performance inferior to PMR hard drives; the same PMR hard drives also have annualised failure rates that are high and low, and too many netizens buy the wrong hard drive resulting in a single mistake.
Generally speaking, PMR drives have a better life and stability than SMR drives; when the capacity of a single drive is large (≥8TB), an enterprise, helium drive is a good choice.
This article will cover the following:
- How to tell if a drive is SMR or PMR based on the drive model
- How to know which drive has a lower annualised failure rate
- What are the recommended models of mechanical hard drives by capacity
This article is not short, so please make good use of the directory jump and the "CTRL+F" shortcut.
HDD Platter Capacity Database
The HDD Platter Capacity DatabasePerhaps the world's most comprehensive database of mechanical hard drive product information, a collection of information on almost all hard drives from all major manufacturers to date, not sure if the drive is pmr or smr?
- Screenshot of page preview
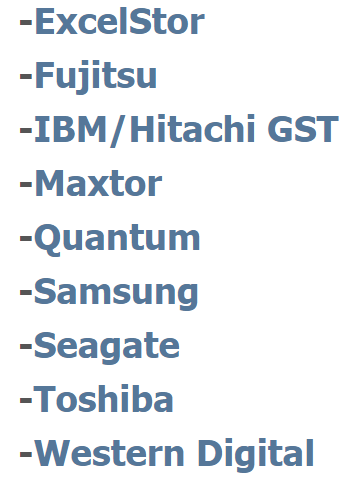
This site is designed to record the disk density, number of platters, number of read/write heads and magnetic recording methods of currently available (even discontinued) mechanical hard drives, where you can find information on the parameters of almost any mechanical hard drive. It records information on西部数据Hard drive data from nine mechanical hard drive manufacturers, including Seagate and Toshiba.
- Screenshot of nine hard drive manufacturers' names
- ** information search **
For example, if we intend to purchase a Western Digital mechanical hard drive, click on [Western Digital] in the image above to access the details screen.
- Model Categories
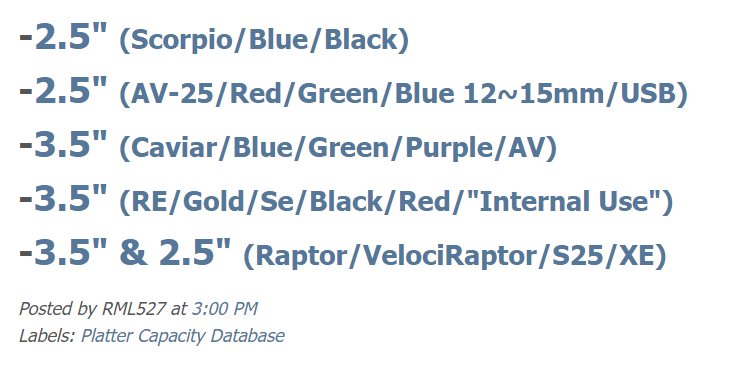
Western Digital's hard drive information is divided into 5 sections by size and series, with 2.5" being for laptop drives and mobile drives. If we intend to view information on the 3.5" Purple Drive series of hard drives, then we need to go to【-3.5" (Caviar/Blue/Green/Purple/AV)】, go to the following screen.
- Screenshot of the summary screen
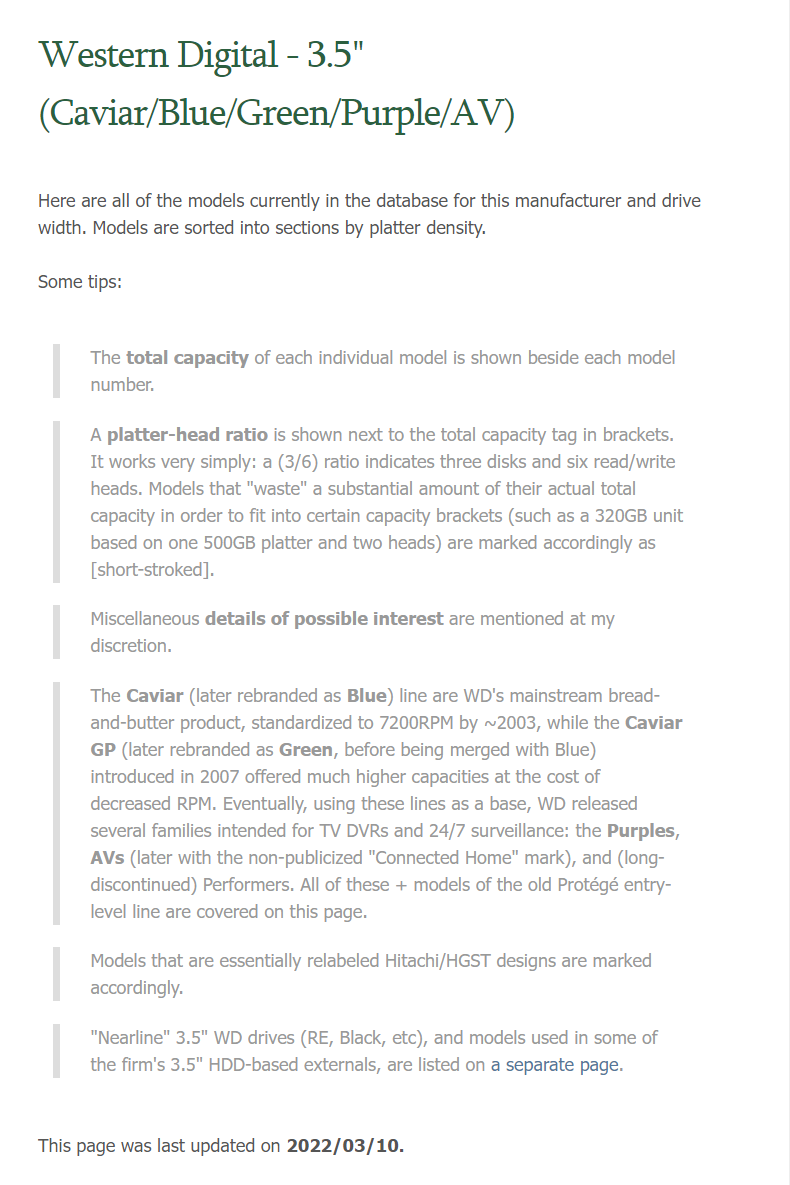
The description is still given first, then the parameters are listed according to the capacity of the single disc
- Screenshot of the parameter preview
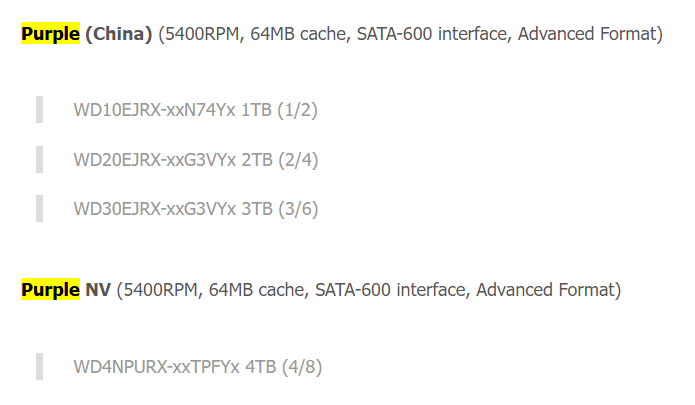
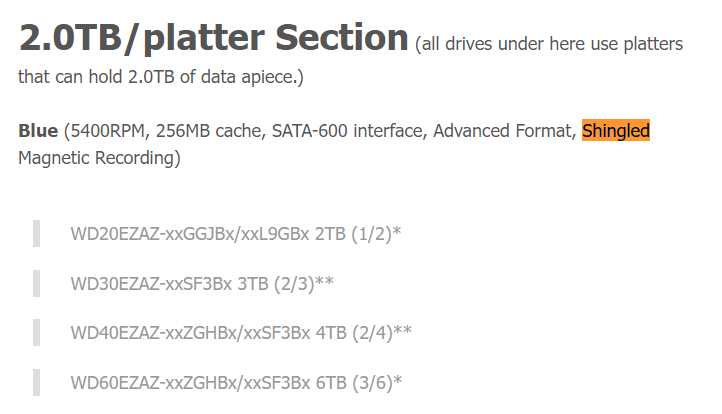
For SMR drives it will be marked [Shingled Magnetic Recording].
- Screenshot of Shingled search results
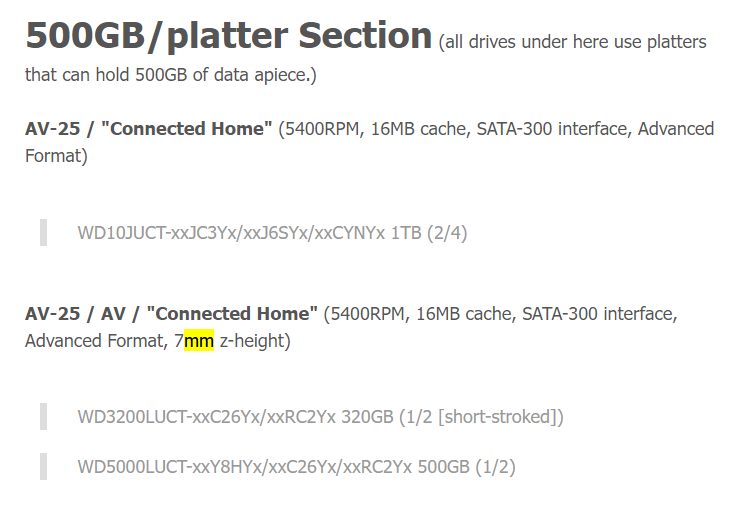
For 2.5" laptop hard drives, they are additionally marked if they are not [9.5mm height].
- Screenshot of hard drive size search
**Backblaze**
Search for the keyword Hard Drive Stats for + years in the Backblaze website, e.g. Hard Drive Stats for 2022
- Screenshot of web preview
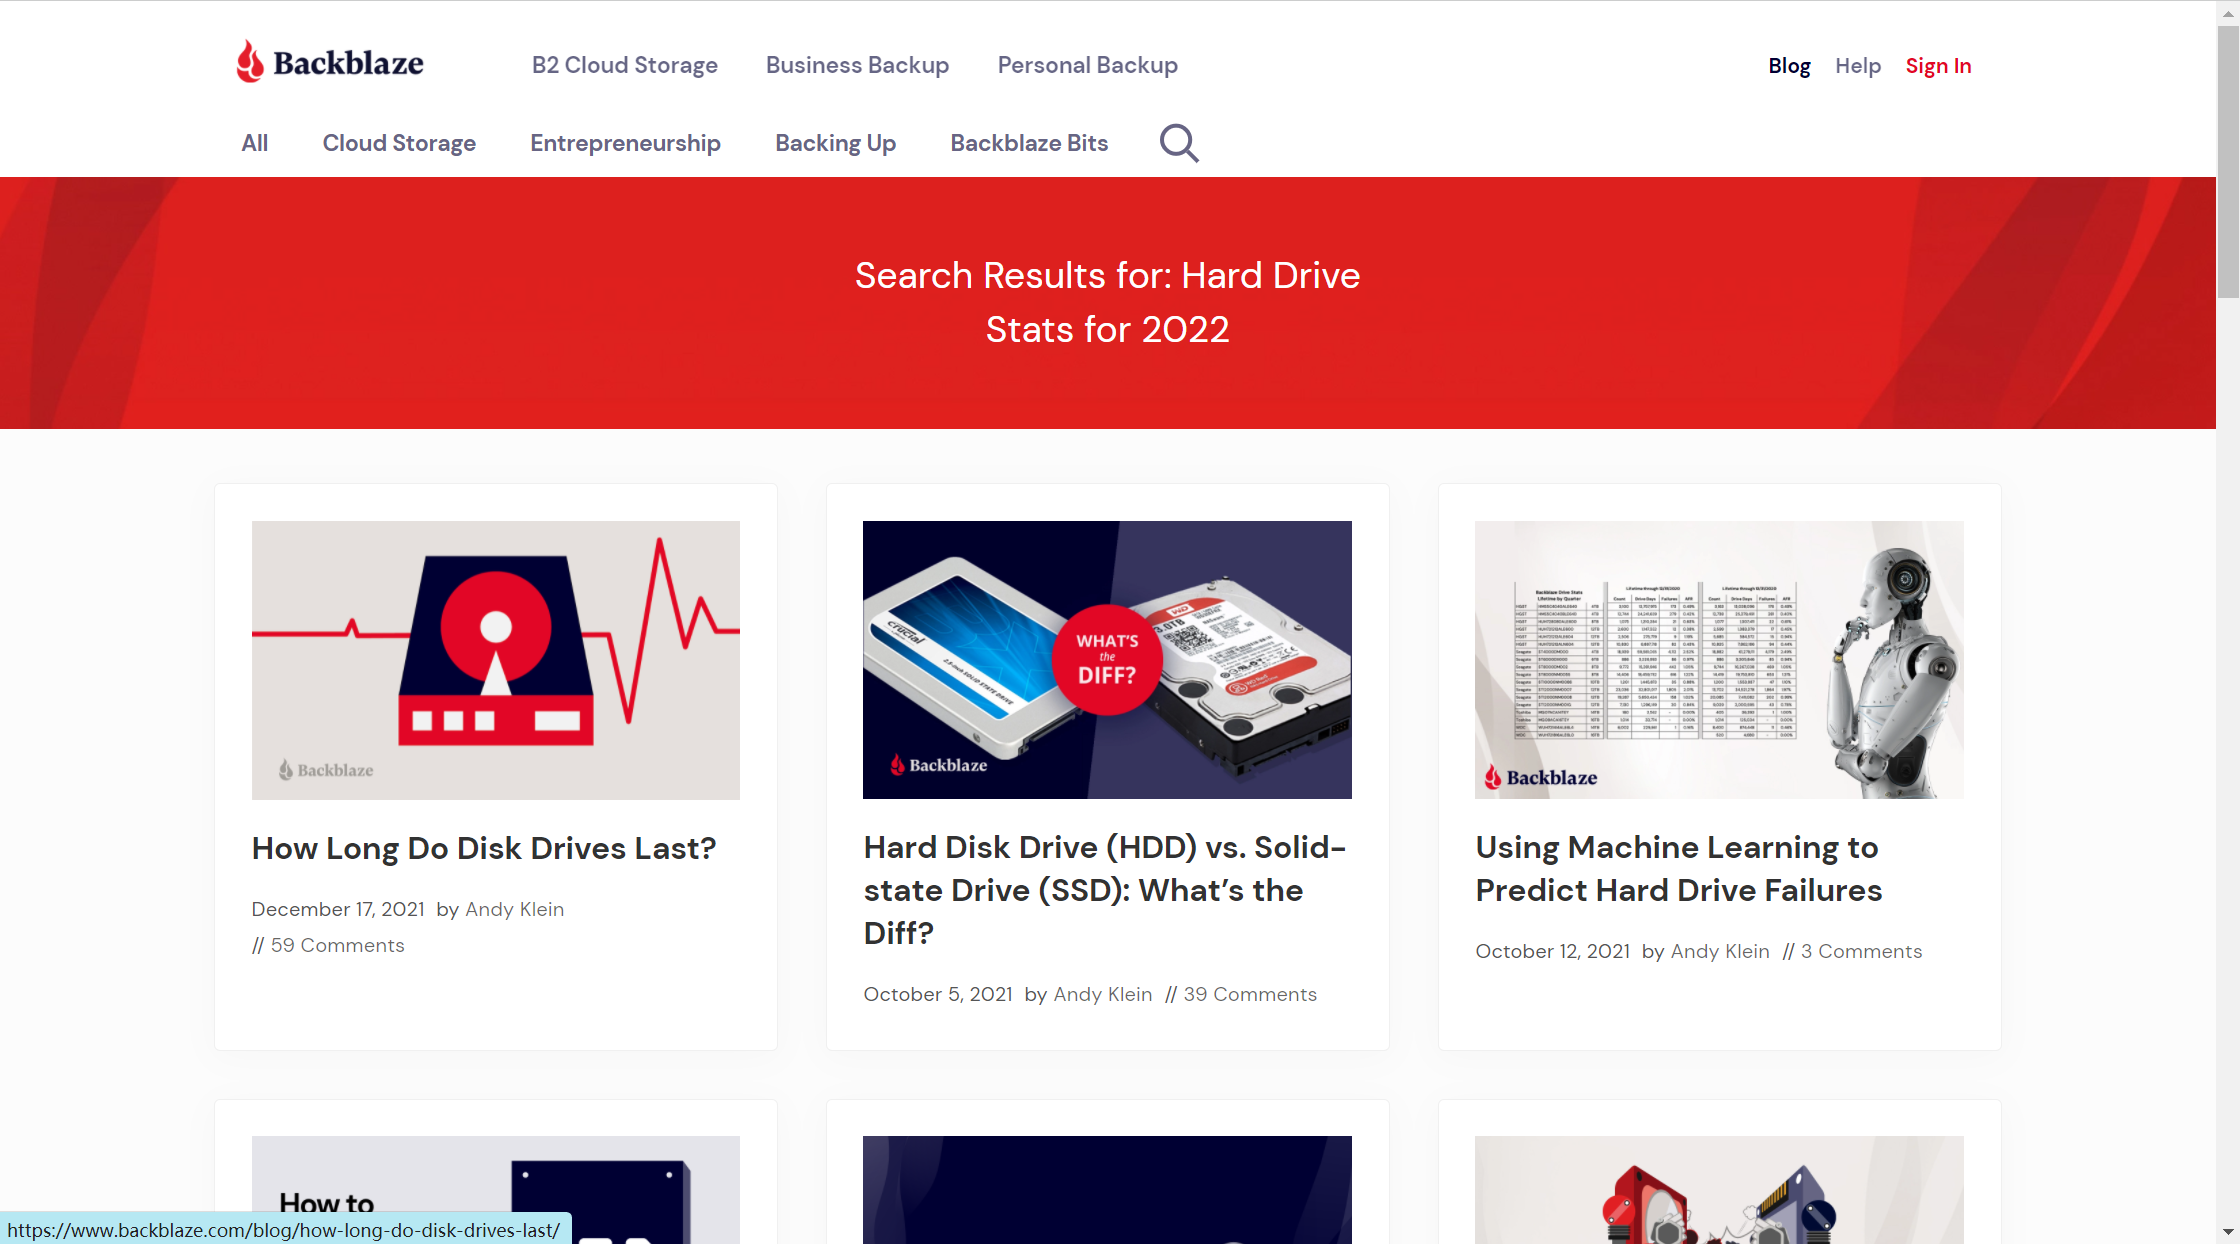
Backblaze is a world-class* professional cloud backup service provider that operates with a large number of stable, cost-effective drives. backblaze's data on the number of drives currently in use and the annualised failure rate of drives is an important reference when purchasing drives!
The annualised failure rate is a good indicator of a drive's reliability, taking into account factors such as usage time and lifespan.
Backblaze produces a quarterly and annual AFR report, which will tell you which capacity and model of which brand has the highest AFR and which is the most stable, so if you don't want to know more, it's often best to buy on the basis of a low AFR.
2021 Annualised Failure Rate Report
- The following chart shows the annualised HDD failure rate report for 2021
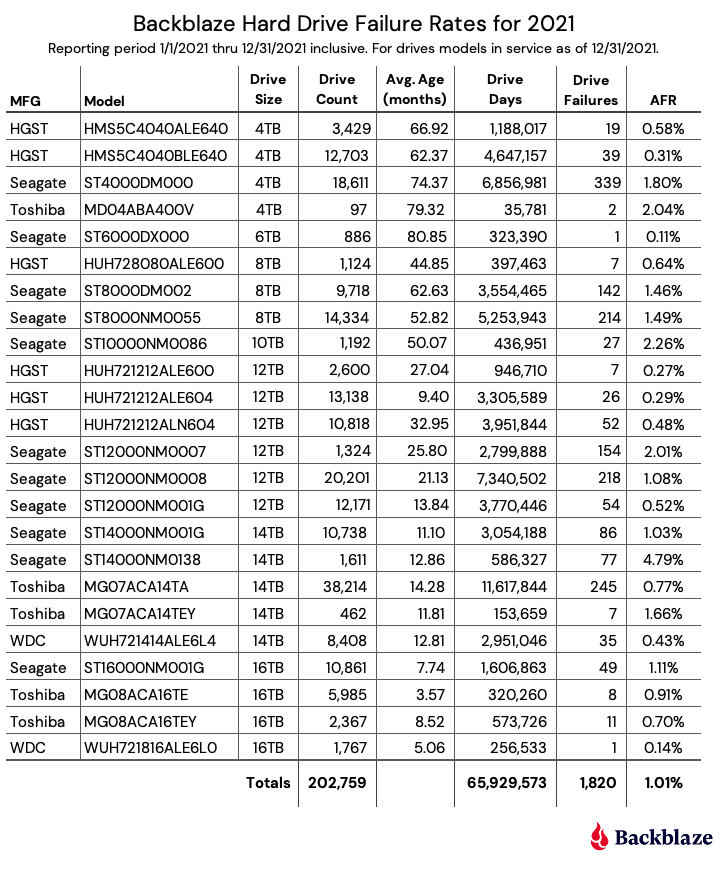
- Report Analysis The 6TB Seagate (model: ST6000DX000) has the lowest failure rate of any drive model with an annualised failure rate (AFR) of 0.11%. This is even more impressive when you consider that this 6TB drive model is the oldest drive in the fleet with an average usage time of 80.4 months. The number of drives (323,390 drive days for 886 days and 2021 days) is at the lower end of the,But after nearly seven years of operation, these drives are at the tail end of the tail end of the bathtub curve wobbly. Both drive models are new for 2021 and both are performing well. The 16TB WDC drive group (model: WUH721816ALE6L0) has an average age of 5.06 months and an AFR of 0.14%. This compares to an average age of 3.57 months and an AFR of 0.91% for the 16TB Toshiba drive group (Model: MG08ACA16TE). In both cases, drive days are at the lower end of the range, but both drive models are off to a good start.
**AFR, what does it mean? **
AFR stands for Annualised Failure Rate. This is different from the annualised failure rate where the number of drives per model (cluster) is the same for the entire annual period. In our environment, drives are added and left throughout the year. For example, a new drive installed in Q4 may only contribute 43 days, while a drive that fails in July may contribute 186 days, and a drive that runs continuously throughout the year may contribute 365 days. We calculate the number of drive days contributed by each drive over the entire period and calculate the total annually using the following formula. AFR = (drive failures/(drive days/365)) 100*
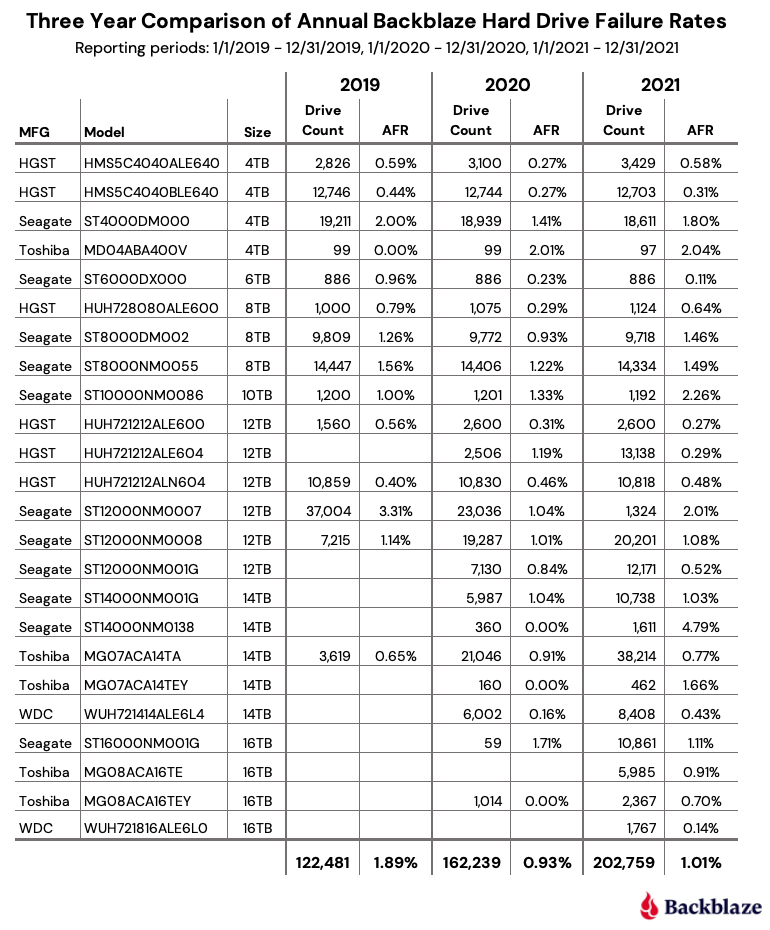
Compare drive statistics for 2019, 2020 and 2021
The table below compares the AFR for each of the last three years. the data for each year includes only that year and the active drive models that appear at the end of each year.
- Drive statistics for 2019, 2020 and 2021
Going a little deeper, we can summarise the different drive models by manufacturer to see how each manufacturer's failure rate has performed over the last three years.
- Diagram summarising the different drive models by manufacturer
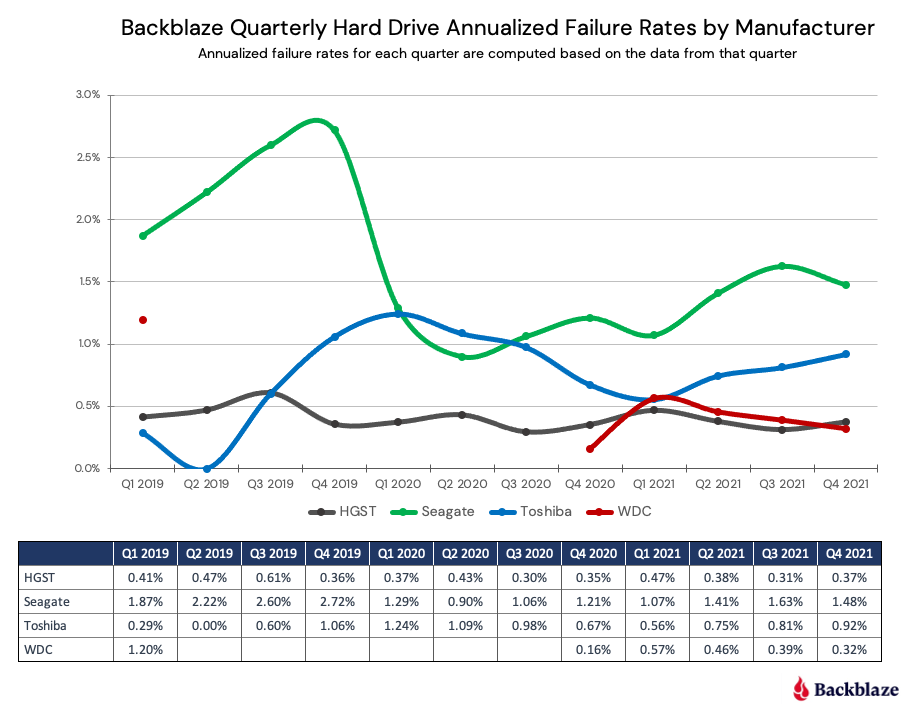
Note that for WDC data, a blank value indicates that there were no countable WDC drives in Backblaze's data centre for that quarter.
Trends for 2021
2021 AFR stays low: In 2021, the AFR for all drives is 1.01%. This is slightly higher than the 0.93% in 2020, but a good sign that the decline in 2020 from 1.83% in 2019 is not an anomaly. what's behind the 1.01% in 2021? Large drives.
- The trend for 2021 is shown in the chart below:
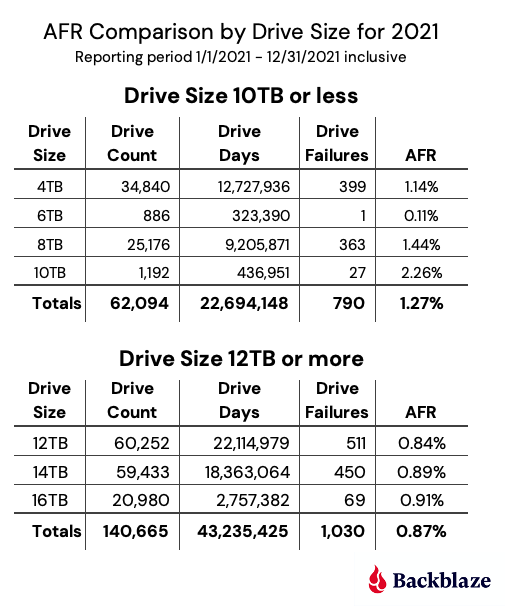
Larger drives have an AFR (defined here as 12TB, 14TB and 16TB drives) that is lower than the 1.01% AFR for all drives in 2021. larger drives represent 69% of the total number of drives, but more importantly, they total 66% of drive days, while only generating 57% of drive failures.
Larger drives are also newer drives, which tend to have lower failure rates than older drives. In fact, the oldest high-capacity drives last an average of 33 months, while the youngest 'small' drives (4TB, 6TB, 8TB and 10TB) last an average of 44.9 months.
In summary, the lower AFR of larger drives is the main influence in keeping the overall AFR low in 2021.
Lifetime Drive Statistics
The graph below shows the Lifetime AFR for all drive models in production as of December 31, 2021.
Lifetime Drive Statistics Chart
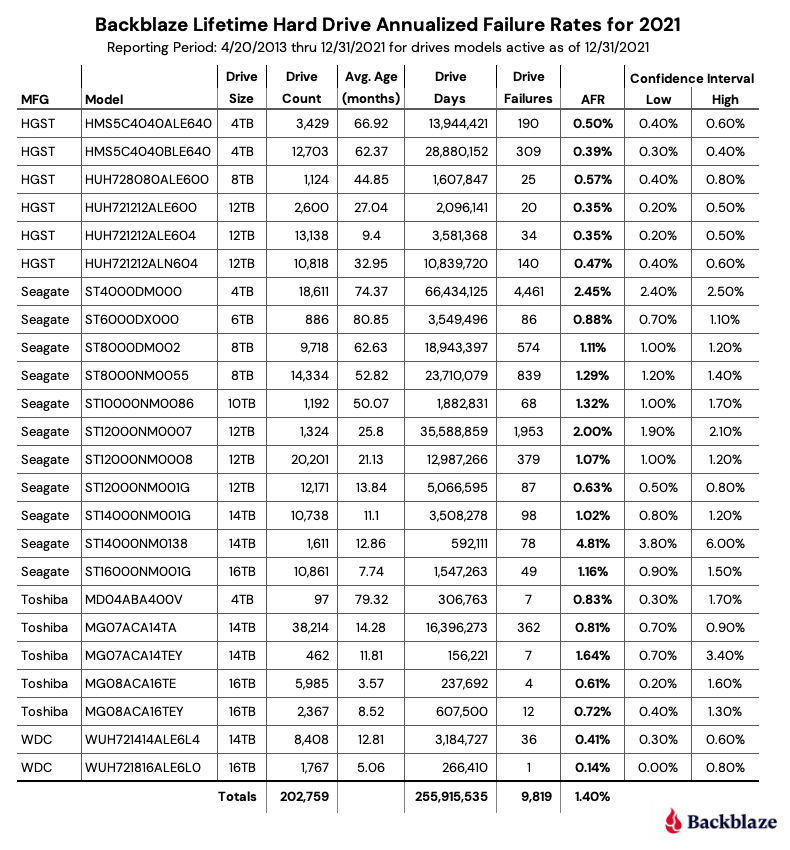
Observations and notes
The lifetime AFR for all the drives listed above is 1.4% and decreasing year on year. at the end of 2020 the AFR is 1.54% and at the end of 2019 the AFR is 1.62%.
When looking at the graphs above, the confidence intervals for some drives are quite wide (>0.5). In these cases we do not actually have enough information about the performance of the drives to have reasonable confidence in the listed AFR (>95%). This is usually the case for smaller numbers of drives or newer drives.
Drive Statistics
The complete data set used to create the information used in this review can be found on Backblaze's Hard Drive Test Data page. You can download and use the data for your own purposes free of charge. Backblaze only asks three things.
1) If you use the data, you cite Backblaze as the source.
2) You accept that you are fully responsible for how the data is used.
3) You will not sell this data to anyone, it is free of charge.
If you only want the summary data used to create the tables and charts in this blog post, you can download a ZIP file containing each chart s CSV file as a ZIP file.
Finally, good luck and please let us know if you find anything interesting.