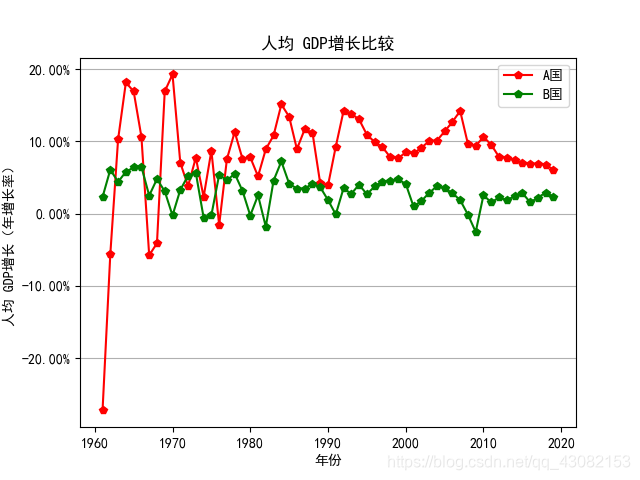
项目一:利用世界银行公开数据平台提供的宏观经济数据比较最近40年间A国与B国的人均国内生产总值的增长率(图表输出)
数据可通过此网页中的下载链接获取:https://data.worldbank.org.cn/?locations=CN-US

# -*- coding: utf-8 -*-
"""
Created on Mon Sept 22 9:11:59 2020

@author: mly
"""
import matplotlib.pyplot as plt
import matplotlib as mpl
import numpy as np
import pandas as pd
from matplotlib import ticker

plt.rcParams['font.sans-serif'] = ['SimHei']
mpl.rcParams["axes.unicode_minus"] = False

df = pd.read_csv('gdpchinaseries.csv')
df2 = pd.read_csv('gdpusaseries.csv')
y = df['gdp']
y1 = df2['gdp']
x = [x for x in range(1961,2020)]

ymajorFormatter = ticker.FormatStrFormatter('%.2f%%') # 设置 y 轴标签文本的格式

plt.figure()
ax = plt.gca()
plt.grid(axis="y")
plt.title('人均 GDP增长比较')
plt.ylabel('人均 GDP增长(年增长率)')
plt.xlabel('年份')
ax.yaxis.set_major_formatter(ymajorFormatter) # 显示百分比
ax.plot(x, y, '-rp', lw = 1.5, label = 'A国')
ax.plot(x, y1, '-gp', lw = 1.5, label = 'B国')
ax.legend(loc = 'upper right')


plt.show()
运行结果: